
#figuresfriday

Top 10 U.S. Metros with the Most Foreclosure Starts in March 2023
According to ATTOM’s newly released Q1 2023 U.S. Foreclosure Market Report, there were a total of 36,617 U.S. properties with foreclosure filings in March 2023. That figure was up 19.95 percent from February 2023 and up 9.85 percent from March 2022. ATTOM’s latest foreclosure activity analysis found that nationwide in March 2023, one in every... Read More »

Top 10 U.S. Housing Markets Where Wages Are Outpacing Home Prices
According to ATTOM’s recently released Q1 2023 U.S. Home Affordability Report, the mixed picture facing home buyers – prices remaining a financial stretch but getting a bit more affordable – reflects a softening of the U.S. housing market combined with rising wages, at a time when home-mortgage rates have stabilized following a year of increases.... Read More »
Top 10 U.S. Counties with Highest Effective Property Tax Rates in 2022
According to ATTOM’s 2022 Property Tax Analysis for 87 million U.S. single family homes, $339.8 billion in property taxes were levied on single-family homes in 2022. That figure is up 3.6 percent from $328 billion in 2021, and more than double the 1.6 percent growth last year; although smaller than the 5.4 percent increase the prior year. ATTOM’s... Read More »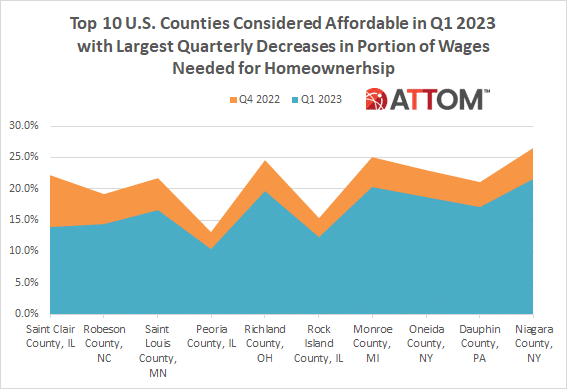
Top 10 U.S. Counties with Largest Quarterly Decreases in Portion of Wages Needed for Homeownership
According to ATTOM’s Q1 2023 U.S. Home Affordability Report, median-priced single-family homes and condos are less affordable in Q1 2023 compared to historical averages in 94 percent of U.S. counties analyzed. That figure is far above the 62 percent of counties that were historically less affordable in Q1 2022. ATTOM’s latest home affordability... Read More »

Top 10 SFR Growth Markets for 2023 with Greatest Annual Increases in Rental Returns
ATTOM’s just released Q1 2023 U.S. Single Family Rental Market Report, which ranks the best U.S. counties for buying single-family rental properties in 2023, found that the average annual gross rental yield on three-bedroom properties (annualized gross rent income divided by purchase price) is projected to be 7.5 percent in 2023. According to... Read More »