According to ATTOM’s Q1 2023 U.S. Home Affordability Report, median-priced single-family homes and condos are less affordable in Q1 2023 compared to historical averages in 94 percent of U.S. counties analyzed. That figure is far above the 62 percent of counties that were historically less affordable in Q1 2022.
ATTOM’s latest home affordability report noted that buying conditions, however, may be improving as the portion of average wages nationwide required for typical major home-ownership expenses has fallen slightly to 30 percent this quarter.
As noted in the Q1 2023 home affordability report, the latest percentage is still considered unaffordable by common lending standards, which call for a 28 percent debt- to-income ratio. The report noted that figure also remains well above the 25 percent level in Q1 2022, but has inched downward from 31 percent in the final months of last year.
Also according to ATTOM’s latest analysis, major home-ownership expenses on typical homes are considered unaffordable to average local wage earners in Q1 2023 in about two-thirds of the counties analyzed, based on the 28 percent guideline. The report noted that counties with the largest populations that are unaffordable in Q1 2023 include Los Angeles County, CA; Maricopa County (Phoenix), AZ; San Diego County, CA; Orange County, CA (outside Los Angeles) and Kings County (Brooklyn), NY.
ATTOM’s Q1 2023 home affordability report also found that the most populous of the 199 counties where major expenses on median-priced homes remain affordable for average local workers in Q1 2023 are Cook County (Chicago), IL; Harris County (Houston), TX; Wayne County (Detroit), MI; Philadelphia County, PA, and Franklin County (Columbus), OH.
The report stated that counties with the largest quarterly decrease in the portion of average local wages needed for major ownership expenses include Marin County, CA (outside San Francisco) (down from 102 percent in the fourth quarter of 2022 to 87.8 percent in the first quarter of 2023); Washington County, UT (northeast of Las Vegas, NV) (down from 73.5 percent to 62.6 percent); Santa Cruz County, CA (down from 110.9 percent to 100.8 percent); Nevada County, CA (outside Reno, NV) (down from 71.5 percent to 61.7 percent) and Alameda County (Oakland), CA (down from 71.4 percent to 61.8 percent).
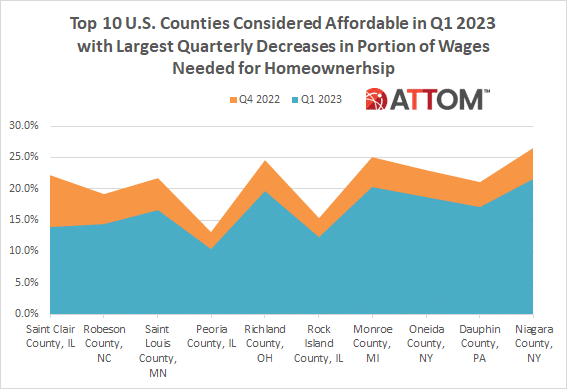
In this post, we dive into the data behind the latest ATTOM home affordability report to reveal the top 10 U.S. counties considered affordable in Q1 2023, with the largest quarterly decreases in the portion of average local wages needed for major ownership expenses.
Those counties include: Saint Clair County, IL (down from 22.1 percent to 13.8 percent); Robeson County, NC (down from 19.2 percent to 14.5 percent); Saint Louis County, MN (down from 21.8 percent to 16.6 percent); Peoria County, IL (down from 13.1% to 10.4 percent); Richland County, OH (down from 24.6 percent to 19.6 percent); Rock Island County, IL (down from 15.4 percent to 12.3 percent); Monroe County, MI (down from 25.1 percent to 20.2 percent); Oneida County, NY (down from 22.9 percent to 18.6 percent); Dauphin County, PA (down from 21.0 percent to 17.1 percent); and Niagara County, NY (down from 26.5 percent to 21.6 percent).
ATTOM’s latest home affordability report also noted that despite improving affordability, annual wages of more than $75,000 still are needed to pay for major costs on the median-priced home purchased during Q1 2023 in 50 percent of the markets analyzed.
Want to learn more about home affordability in your area? Contact us to find out how!
