
Portion of Wages Needed for Home Ownership Exceeds 28 Percent Lending Benchmark in Almost Three-Quarters of Nation; But Affordability Now Better Than Historical Averages in Half the Country; Coronavirus Yet to Have Major Impact on Home Affordability
IRVINE, Calif. – June 25, 2020 — ATTOM Data Solutions, curator of the nation’s premier property database and first property data provider of Data-as-a-Service (DaaS), today released its second-quarter 2020 U.S. Home Affordability Report, showing that median home prices of single family homes and condos in the second quarter of 2020 are more affordable than historical averages in 49 percent of U.S. counties with enough data to analyze, up from 31 percent a year ago.
The report determined affordability for average wage earners by calculating the amount of income needed to make monthly house payments — including mortgage, property taxes and insurance — on a median-priced home, assuming a 3 percent down payment and a 28 percent maximum “front-end” debt-to-income ratio. That required income was then compared to annualized average weekly wage data from the Bureau of Labor Statistics (see full methodology below).
Compared to historical levels, 200 of the 406 counties analyzed in the second quarter are now more affordable, up from 126 of the same group of counties in the second quarter of 2019. The gains have come as higher wages, along with cheaper mortgage costs resulting from declining interest rates, outweigh ongoing price increases that commonly have exceeded 5 percent in the current quarter.
Despite the improved buying conditions, major costs on median-priced homes remain unaffordable to average wage earners in 74 percent of counties included in the second quarter of 2020 analysis. That means major home ownership costs would consume more than 28 percent of average wages from county to county.
“The latest affordability numbers reveal a win-win situation for sellers as well as buyers. Prices are rising again around the country during the current home-buying season, despite worries that the economic impact of the Coronavirus pandemic would halt the nine-year runup in home values. But a combination of wage gains and declining mortgage rates are helping to override the increases and make homes more affordable in large swaths of the United States,” said Todd Teta, chief product officer with ATTOM Data Solutions. “Virus pandemic concerns are still quite valid and may show up in the coming months, which could hurt prices as well as affordability. That remains a significant potential cloud hanging over the market. But as of now, things are looking up for people on both sides of the buying equation.”
Home prices up at least 5 percent annually in majority of country
Median home prices in the second quarter of 2020 are up by at least 5 percent from the second quarter of 2019 in 210, or 52 percent, of the 406 counties included in the report. Counties are included if they have a population of at least 100,000 and at least 50 single family home and condo sales in the second quarter of 2020.
Among the 41 counties with a population of at least 1 million, the biggest year-over-year price gains are in Philadelphia County, PA (up 22 percent); Bronx County, NY (up 13 percent); Mecklenburg County (Charlotte), NC (up 12 percent); Dallas County, TX (up 11 percent) and Orange County (Orlando), FL (up 10 percent).
Price appreciation outpacing wage growth in two-thirds of markets
Home price appreciation is outpacing average weekly wage growth in the second quarter of 2020 in 269 of the 406 counties analyzed in the report (66 percent), with the largest counties including Cook County (Chicago), IL; Maricopa County (Phoenix), AZ; Miami-Dade County, FL; Dallas County, TX and Riverside County (outside Los Angeles), CA.
Average annualized wage growth is outpacing home price appreciation in the second quarter of 2020 in 137 of the 406 counties (34 percent), including Los Angeles County, CA; Harris County (Houston), TX; San Diego County, CA; Orange County (outside Los Angeles), CA and Kings County (Brooklyn), NY.
At least 30 percent of wages needed to buy a home in two-thirds of markets
Major ownership costs on the median-priced home in the second quarter of 2020 consume at least 30 percent of the average wages of local workers in 276 of the 406 counties analyzed in this report (68 percent). Those counties that require the greatest percentage are led by Marin County, CA (outside San Francisco) (109.4 percent of annualized weekly wages needed to buy a home); Santa Cruz County, CA, (outside San Jose) (98.4 percent); Kings County (Brooklyn), NY (98.3 percent); Maui County, HI (84.1 percent) and Monterey County, CA, (outside San Francisco) (82.7 percent).
Aside from Kings County, NY, counties with a population of at least 1 million where home ownership consumes at least 30 percent of average local wages include Orange County (outside Los Angeles), CA (77.7 percent); New York County (Manhattan), NY (74.9 percent); Queens County, NY (74.3 percent) and Alameda County (outside San Francisco), CA (73 percent).
A total of 130 counties in the report (32 percent) require less than 30 percent of their annualized weekly wages to buy a home in the second quarter of 2020. Those counties that require the smallest percent include Macon County (Decatur), IL (10.4 percent of annualized weekly wages needed to buy a home); Rock Island County (Davenport), IL (13.4 percent); Montgomery County, AL (15.1 percent); Oswego County (outside Syracuse), NY (17.9 percent) and Richmond County (Augusta), GA (18.1 percent).
Among 41 counties in the report with a population of at least 1 million, the only ones where home ownership consumes less than 30 percent of average local wages are Cuyahoga County (Cleveland), OH (18.6 percent); Philadelphia County, PA (21.2 percent); Harris County (Houston), TX (26.2 percent); Fulton County (Atlanta), GA (27.8 percent) and Oakland County (outside Detroit), MI (27.8 percent).
Average wage needed to afford median-priced home exceeds $75,000 in a third of markets
An annual wage of at least $75,000 is needed to afford the typical home in 141, or 35 percent, of the 406 markets in the report.
The highest annual wages required to afford the typical home are in New York County (Manhattan), NY ($341,401); San Francisco County, CA ($332,317); San Mateo County (outside San Francisco), CA ($326,709); Marin County (outside San Francisco), CA ($289,269); and Santa Clara County (San Jose), CA ($282,021). Eighteen of the 25 most costly markets are in New York or California.
The lowest annual wages required to afford a median-priced home in the second quarter of 2020 are in Macon County (Decatur), IL ($19,572); Montgomery County, AL ($25,726); Trumbull County (outside Youngstown), OH ($26,444); Rock Island County, IL ($27,856); and Sumter County, SC ($28,864).
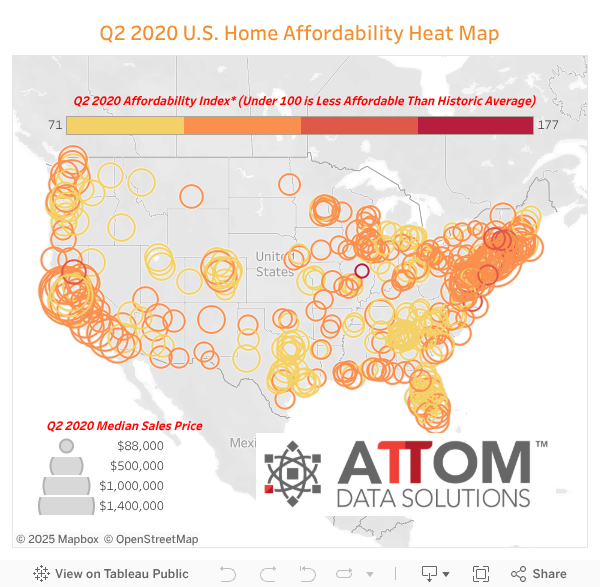
Forty-nine percent of markets more affordable than historic averages
Among the 406 counties analyzed in the report, 200 (49 percent) are more affordable than their historic affordability averages in the second quarter of 2020, down from 62 percent of counties in the previous quarter but up from 31 percent in the second quarter of 2019.
Counties with at least 1 million people that are more affordable than their historic averages (indexes below 100 are considered more affordable compared to their historic averages) include Suffolk County (Long Island), NY (index of 120); New York County (Manhattan), NY (115); Nassau County (outside New York City), NY (112); Montgomery County, MD (outside Washington, D.C.) (112) and Kings County (Brooklyn), NY (109).
Counties with the best affordability indexes are Macon County (Decatur), IL (index of 177); Berkshire County (Pittsfield), MA (134); Newport News City/County, (VA) (133); Hampshire County (outside Springfield), MA (132) and Morris County (outside Newark), NJ (130).
Among counties with at least 1 million people, those where the quarterly affordability indexes have improved the most are Kings County (Brooklyn), NY (index up 7 percent); San Bernardino County (outside Los Angeles), CA (up 4 percent); Los Angeles County, CA (up 3 percent); Orange County (outside Los Angeles), CA (up 3 percent) and Queens County, NY (up 3 percent).
The biggest annual gains among other counties include Berkshire County (Pittsfield), MA (index up 23 percent); Bay County (Panama City), FL (up 11 percent); Hampshire County (outside Springfield), MA (up 10 percent); Jefferson County (outside St. Louis), MO (up 10 percent) and San Luis Obispo (north of Los Angeles), CA (up 8 percent).
Remaining markets less affordable than historic averages
Among the 406 counties in the report, 206 (51 percent) are less affordable than their historic affordability averages in the second quarter of 2020, up from 38 percent in the first quarter of 2020 but down from 69 percent in the second quarter of last year.
Counties with a population greater than 1 million that are less affordable than their historic averages (indexes of less than 100 are considered less affordable compared to their historic averages) include Philadelphia County, PA (index of 80); Dallas County, TX (81); Mecklenburg County (Charlotte), NC (85); Tarrant County (Fort Worth), TX (85) and Fulton County (Atlanta), GA (85).
Counties with the worst affordability indexes are Muskegon County, MI (index of 71); Genesee County (Flint), MI (71); Baltimore City/County, MD (71); Benton County (Kennewick), WA (73) and Ingham County (Lansing), MI (75).
Counties with at least 1 million people that have seen the biggest quarterly decline in their affordability indexes include Philadelphia County, PA (index down 15 percent); Cook County (Chicago), IL (down 13 percent); Fulton County (Atlanta), GA (down 12 percent); Bronx County, NY (down 9 percent) and Mecklenburg County (Charlotte), NC (down 8 percent).
The biggest quarterly decreases among other counties include Baltimore City/County, MD (index down 55 percent); Tompkins County (Ithaca), NY (down 28 percent); Greene County (outside Dayton), OH (down 28 percent); Blair County (Altoona), PA (down 27 percent) and St. Louis City/County, MO (down 25 percent).
Report Methodology
The ATTOM Data Solutions U.S. Home Affordability Index analyzes median home prices derived from publicly recorded sales deed data collected by ATTOM Data Solutions and average wage data from the U.S. Bureau of Labor Statistics in 406 U.S. counties with a combined population of 209.6 million. The affordability index is based on the percentage of average wages needed to make monthly house payments on a median-priced home with a 30-year fixed rate mortgage and a 3 percent down payment, including property taxes, home insurance and mortgage insurance. Average 30-year fixed interest rates from the Freddie Mac Primary Mortgage Market Survey were used to calculate the monthly house payments.
The report determined affordability for average wage earners by calculating the amount of income needed to make monthly house payments — including mortgage, property taxes and insurance — on a median-priced home, assuming a 3 percent down payment and a 28 percent maximum “front-end” debt-to-income ratio.
About ATTOM Data Solutions
ATTOM Data Solutions provides premium property data to power products that improve transparency, innovation, efficiency and disruption in a data-driven economy. ATTOM multi-sources property tax, deed, mortgage, foreclosure, environmental risk, natural hazard, and neighborhood data for more than 155 million U.S. residential and commercial properties covering 99 percent of the nation’s population. A rigorous data management process involving more than 20 steps validates, standardizes and enhances the data collected by ATTOM, assigning each property record with a persistent, unique ID — the ATTOM ID. The 9TB ATTOM Data Warehouse fuels innovation in many industries including mortgage, real estate, insurance, marketing, government and more through flexible data delivery solutions that include bulk file licenses, property data APIs, real estate market trends, marketing lists, match & append and introducing the first property data delivery solution, a cloud-based data platform that streamlines data management – Data-as-a-Service (DaaS).
Media Contact:
Christine Stricker
949.748.8428
christine.stricker@attomdata.com
Data and Report Licensing:
949.502.8313