This week ATTOM Data Solutions released its Q4 and 2018 Year-End Home Flipping report. The report showed that 207,957 U.S. single family homes and condos were flipped in 2018, down 4 percent from the 216,537 home flips in 2017.
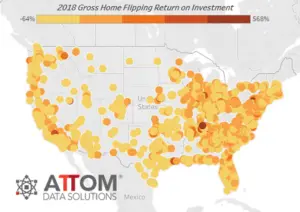
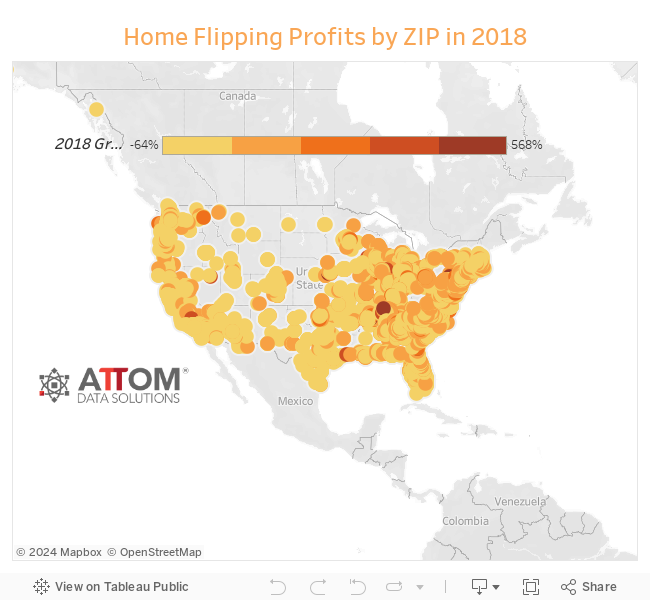
However, did you know that ATTOM Data drills all the way down to the zip code level for this specific report? In fact, most of ATTOMs reports consist of various granular geo levels being analyzed, but the flipping report can really help real estate investors who are looking for their next move. If you are interested in learning more about how to obtain a detailed flipping analysis, visit our home flipping report page.
Average time to flip down slightly from 2017
Homes flipped in 2018 took an average of 180 days to complete the flip, down from 181 days in 2017 but up from 159 average days to flip 10-years ago.
Among 6,013 zip codes with at least 10 home flips completed in 2018 and a population greater than 5,000, those with the longest average time to flip were in zip codes 95742 located in Sacramento, California (301 days); 85935 located in Show Low, Arizona (285 days); 77441 located in Houston, Texas (285 days); 98116 located in Seattle, Washington (280 days); and 53532 located in Madison, Wisconsin (277 days).
Zip Codes with a Hot Home Flipping Rate
Among 6,013 zip codes with at least 10 home flips completed in 2018 and a population greater than 5,000, the highest home flipping rate was in 38141 in Memphis where home flips represented 29.5 percent of all home sales for the year. Other zip codes in the top 20 for highest 2018 home flipping rate included zip codes in Donna, Texas; Miami, Florida; Washington, D.C.; Jamaica, New York; Baton Rouge, Louisiana; Compton, California; and Phoenix, Arizona.
The home flipping rate, just tells part of the story but where is the money at?
Zip Codes Ripe for the Dollar
Completed home flips in 2018 yielded an average gross profit of $65,000 (difference between median purchase price and median flipped sale price), down 3 percent from an average gross flipping profit of $66,900 in 2017.
Most of the time to make money, you need to spend money. Therefore, the greatest flipping profits (high-dollar volume) mainly occurred on the West coast but some mid-west areas were sprinkled in there as well.
For instance, in keeping with the same methodology as notated about those zip codes that had a high gross profit over $500,000 were 90291 in Los Angeles, California ($906,000 gross profit); 94303 in San Jose, California ($769,000 gross profit); 90046 in Los Angeles ($755,000 gross profit); 98004 in Seattle, Washington ($720,000 gross profit); 91403 again in Los Angeles ($676,500); 94087 in San Jose ($670,000); 20016 in D.C. ($624,000); 37215 in Nashville, Tennessee ($595,000); and another San Jose zip code – 95050 ($519,500).
Want more? Contact us now!