Top Major Market Flipping Rates in Memphis, Phoenix, Las Vegas, Tampa, Birmingham; Almost $20 Billion In Financed Flips in 2018, Up 8 Percent From 2017 to 11-Year High
IRVINE, Calif. – February, 28 2019 — ATTOM Data Solutions, curator of the nation’s premier property database, today released its Q4 and Year-End 2018 U.S. Home Flipping Report, which shows that 207,957 U.S. single family homes and condos were flipped in 2018, down 4 percent from the 216,537 home flips in 2017.
The 207,957 homes flipped in 2018 represented 5.6 percent of all single-family home and condo sales during the year, stagnant from 5.6 percent of all sales in 2017 but up from 5.1 percent of all sales back in 2008.
A total of 146,020 entities (individuals and institutions) flipped homes in 2018, down .4 percent from the 146,623 entities that flipped in 2017 but up 63.1 percent from 89,539 entities that flipped 10-years ago.
“With mortgage rates remaining strong and people staying in their homes longer, we have started to see a bit of a flipping rate slowdown,” said Todd Teta, chief product officer at ATTOM Data Solutions. “However, this isn’t to say home flipping is going away. The market is still ripe with investors flipping and bargains still await, especially in the lowest-priced areas of the country, where levels of financial distress remain highest.”
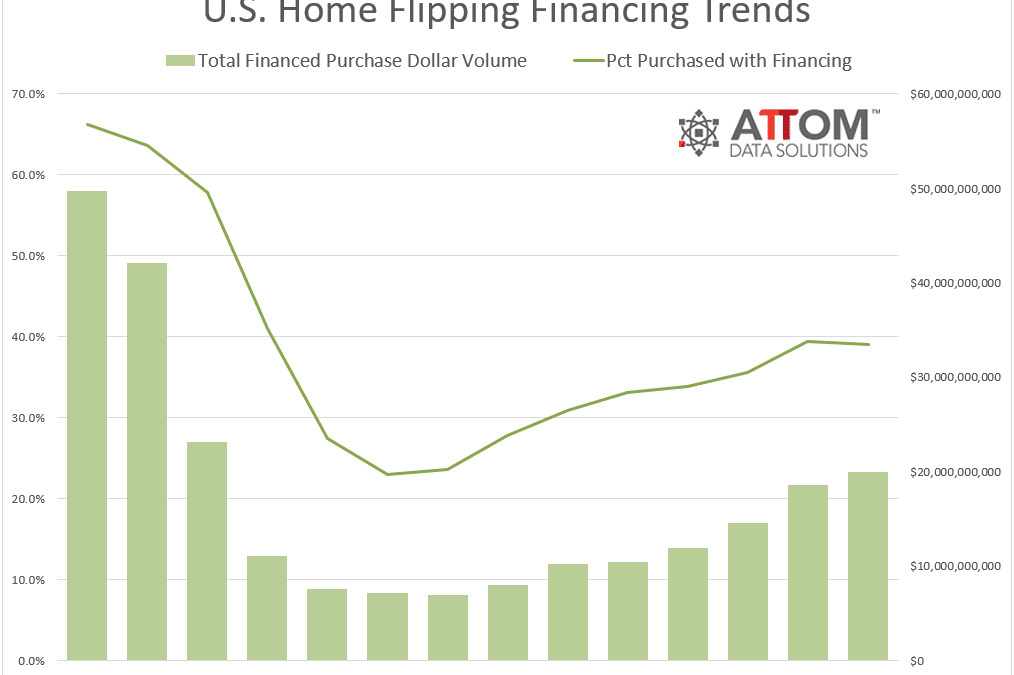
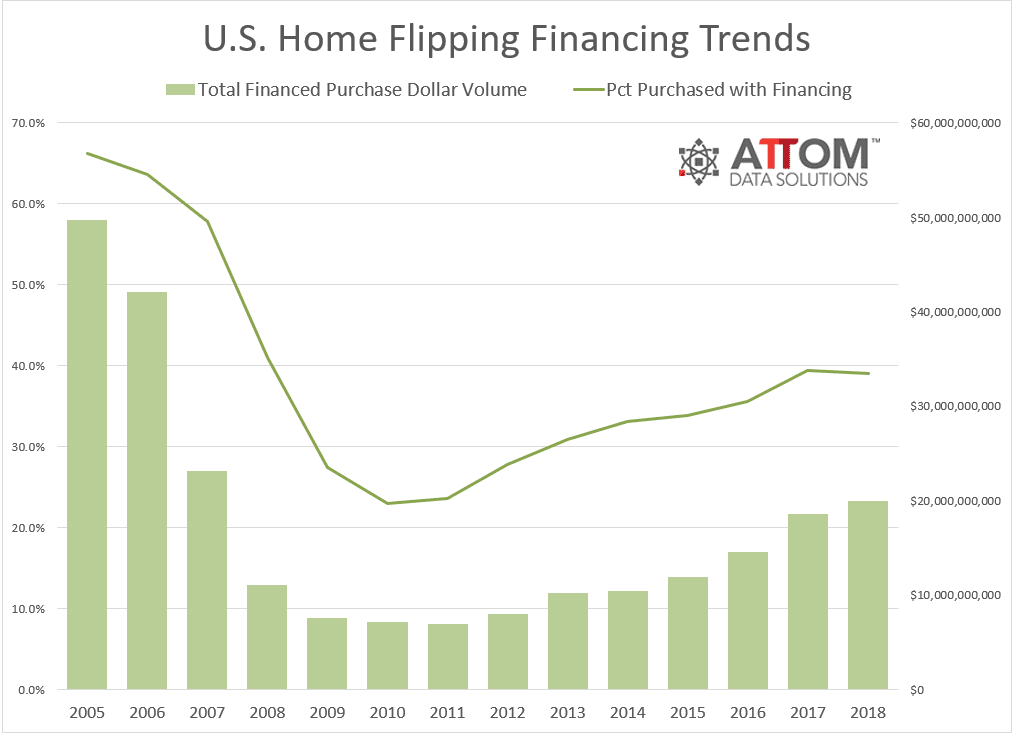
Home flip lending volume up 8 percent to 11-year high
The total dollar volume of financed home flip purchases was $19.9 billion for homes flipped in 2018, up 8 percent from $18.5 billion in 2017 to the highest level since 2007 — an 11-year high.
2018 Year-End Home Flipping Financing Trends
Flipped homes originally purchased by the investor with financing represented 39.1 percent of homes flipped in 2018, down from 39.4 percent in 2017 and down from 41.0 percent in 2008.
Among 53 metropolitan statistical areas analyzed in the report with at least 1 million people, those with the highest percentage of 2018 completed flips purchased with financing were Denver, Colorado (53.7 percent); Providence, Rhode Island (51.8 percent); Seattle, Washington (51.8 percent); San Diego, California (51.6 percent); and San Francisco, California (50.8 percent).
Share of flips sold to FHA buyers at an 11-year low
Of the homes flipped in 2018, 13.8 percent were sold to FHA borrowers — likely first-time homebuyers — down from 17 percent in 2017 to an 11-year low.
Among 53 metro areas analyzed in the report with at least 1 million people, those with the smallest share of completed flips sold to FHA buyers in 2018 were San Jose, California (1.3 percent); Raleigh, North Carolina (4.3 percent); San Francisco, California (6.0 percent); Memphis, Tennessee (6.5 percent); and San Diego, California (7.2 percent).
Among the 53 metro areas analyzed in the report with at least 1 million people, those with the highest share of completed flips sold to all-cash buyers — often other real estate investors — in 2018 were Detroit, Michigan (48.8 percent); Birmingham, Alabama (42.4 percent); Jacksonville, Florida (39.8 percent); Miami, Florida (38.3 percent); and Buffalo, New York (38.0 percent).
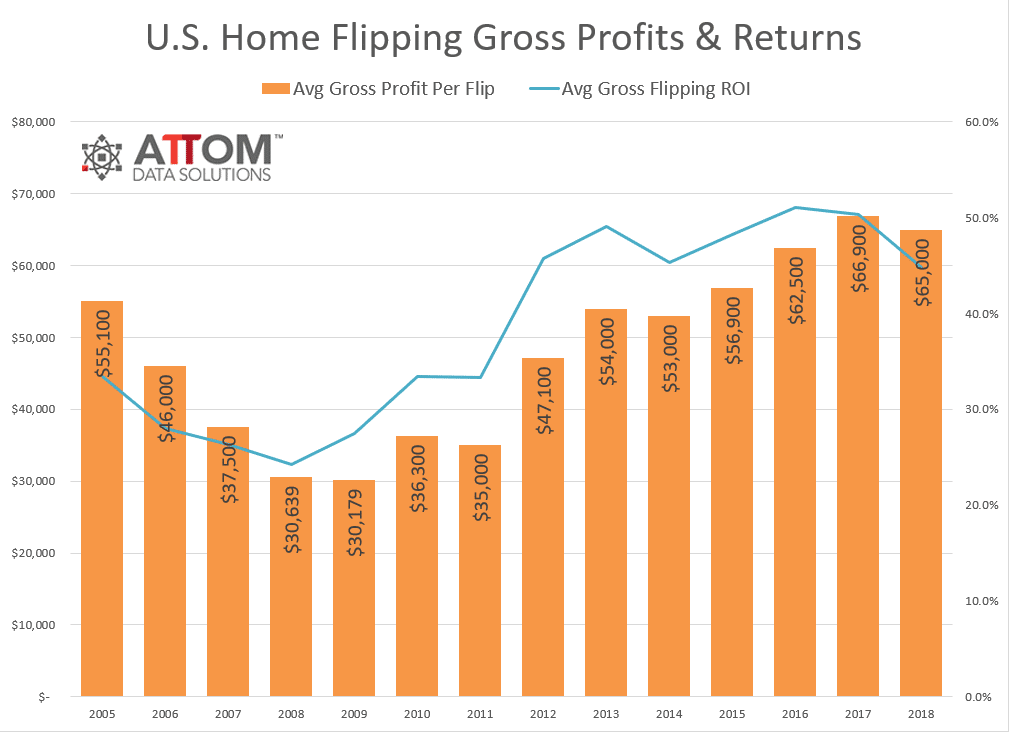
Average home flipping returns drop to a four-year low
Completed home flips in 2018 yielded an average gross profit of $65,000 (difference between median purchase price and median flipped sale price), down 3 percent from an average gross flipping profit of $66,900 in 2017.
2018 Year-End Home Flipping Gross Profits and Returns
The average gross flipping profit of $65,000 in 2018 represented an average 44.8 percent return on investment (percentage of original purchase price), down from 50.3 percent in 2017 and down from an all-time high average gross flipping ROI of 51.0 percent in 2016.
Among 176 metro areas with a population of at least 200,000 and at least 100 home flips in 2018, those with the highest average gross flipping ROI were Pittsburgh, Pennsylvania (144.2 percent); Scranton, Pennsylvania (131.7 percent); Atlantic City, New Jersey (113.2 percent); Cleveland, Ohio (112.1 percent); and Erie, Pennsylvania (109.3 percent).
Along with Pittsburgh and Cleveland, other major metro areas with at least 1 million people and gross flipping ROI of at least 80 percent were Philadelphia (109.0 percent); Baltimore (103.5 percent); Buffalo (96.2 percent); Memphis (86.5 percent); and Cincinnati (84.2 percent).
Highest home flipping rates in Memphis, Phoenix, Las Vegas, Tampa, Birmingham
Among 53 metro areas analyzed in the report with at least 1 million people, those with the highest home flipping rate in 2018 were Memphis, Tennessee (11.7 percent); Phoenix, Arizona (9.1 percent); Las Vegas, Nevada (8.7 percent); Tampa-St. Petersburg, Florida (8.2 percent); Birmingham, Alabama (7.6 percent).
Other major markets in the top 10 for highest 2018 home flipping rate were Baltimore, Maryland; St. Louis, Missouri; Philadelphia, Pennsylvania; Orlando, Florida; and Nashville, Tennessee.
Among 6,015 zip codes with at least 10 home flips completed in 2018 and a population greater than 5,000, the highest home flipping rate was in 38141 in Memphis where home flips represented 29.5 percent of all home sales for the year. Other zip codes in the top 20 for highest 2018 home flipping rate included zip codes in Donna, Texas; Miami, Florida; Washington, D.C.; Jamaica, New York; Baton Rouge, Louisiana; Compton, California; and Phoenix, Arizona.
Biggest increase in home flipping rates in Boston, Tucson, Raleigh, Columbus, Hartford
Among metro areas with at least 1 million people, those with the biggest annual increase in home flipping rate in 2018 were Boston, Massachusetts (up 33.3 percent); Tucson, Arizona (up 27.3 percent); Raleigh, North Carolina (up 24.5 percent); Columbus, Ohio (up 13.1 percent); and Hartford, Connecticut (up 12.8 percent).
Other major markets in the top 10 for biggest increase in home flipping rate in 2018 were New York, New York; Charlotte, North Carolina; Grand Rapids, Michigan, Pittsburgh, Pennsylvania and Milwaukee, Wisconsin.
While 20 out of the 53 metro areas with at least 1 million people saw an increase in the home flipping rate in 2018, those that saw a decrease, included Kansas City, Missouri (down 25.2 percent); Buffalo, New York (down 17.5 percent); Indianapolis, Indiana (down 16.3 percent); Seattle, Washington (down 15.9 percent) and Salt Lake City, Utah (down 14.0 percent).
Average time to flip down slightly from 2017
Homes flipped in 2018 took an average of 180 days to complete the flip, down from 181 days in 2017 but up from 159 average days to flip 10-years ago.
Among 176 metro areas with a population of at least 200,000 and at least 100 home flips in 2018, those with the longest average time to flip were Provo, Utah (219 days); Boise, Idaho (215 days); Erie, Pennsylvania (213 days); Gainesville, Florida (213 days); and Kalamazoo, Michigan (212 days).
High-level takeaways from Q4 2018 dataset:
- The 47,071 home flips in Q4 2018 were completed by 37,379 investors, a ratio of 1.26 flips per investor.
- The share of homes flipped in Q4 2018 that were purchased by the flipper with financing represented 36.4 percent of all homes flipped in the quarter, down from 39.1 percent in the previous quarter and down from 39.5 percent in Q4 2017, to a two-year low.
- The average gross flipping profit of home flips in Q4 2018 was $62,000, which represented an average 41.9 percent return on investment (percentage of original purchase price), down from 42.9 percent last quarter and down from 49.6 percent in Q4 2017, to a seven-year low.
- The average square footage of homes flipped in Q4 2018 was 1,408, down from 1,412 in the previous quarter to the smallest average square footage on record for the report, going back to Q1 2005.
- Homes flips completed in Q4 2018 took an average of 175 days, down from 177 days in the previous quarter and down from 178 days in Q4 2017.
Report methodology
ATTOM Data Solutions analyzed sales deed data for this report. A single-family home or condo flip was any transaction that occurred in the year where a previous sale on the same property had occurred within the last 12 months. The average gross flipping profit is the difference between the purchase price and the flipped price (not including rehab costs and other expenses incurred, which flipping veterans estimate typically run between 20 percent and 33 percent of the property’s after repair value). Gross flipping return on investment was calculated by dividing the gross flipping profit by the first sale (purchase) price.
About ATTOM Data Solutions
ATTOM Data Solutions blends property tax, deed, mortgage, foreclosure, environmental risk, natural hazard, and neighborhood data for more than 155 million U.S. residential and commercial properties multi-sourced from more than 3,000 U.S. counties. A rigorous data management process involving more than 20 steps validates, standardizes and enhances the data collected by ATTOM, assigning each property record with a persistent, unique ID — the ATTOM ID. With more than 70 billion rows of transactional-level data and more than 7,200 discrete data attributes, the 9TB ATTOM data warehouse powers real estate transparency for innovators, entrepreneurs, disrupters, developers, marketers, policymakers, and analysts through flexible delivery solutions, including bulk file licenses, APIs and customized reports.
Media Contact:
Christine Stricker
949.748.8428
christine.stricker@attomdata.com
Data and Report Licensing:
949.502.8313
