How Did Foreclosure Activity Change in January 2025?
In January 2025, the U.S. housing market recorded 30,816 properties with foreclosure filings — an 8% increase from December 2024 but 7% lower than January 2024.
- Foreclosure starts rose 8% month-over-month.
- Completed foreclosures (REOs) increased in 30 states but remained on a broader annual decline.
Summary: Foreclosure activity in January 2025 saw a modest monthly increase but is still below year-ago levels, reflecting historically low overall rates.
What’s Driving January 2025 Foreclosure Trends?
According to Rob Barber, CEO of ATTOM, the January rise may partly reflect post-holiday processing catch-up.
He noted that it is too early to call this a trend shift for 2025 and emphasized the need to monitor interest rates, inflation, and employment — all key factors that could impact foreclosure activity.
Foreclosure Rates by State – January 2025
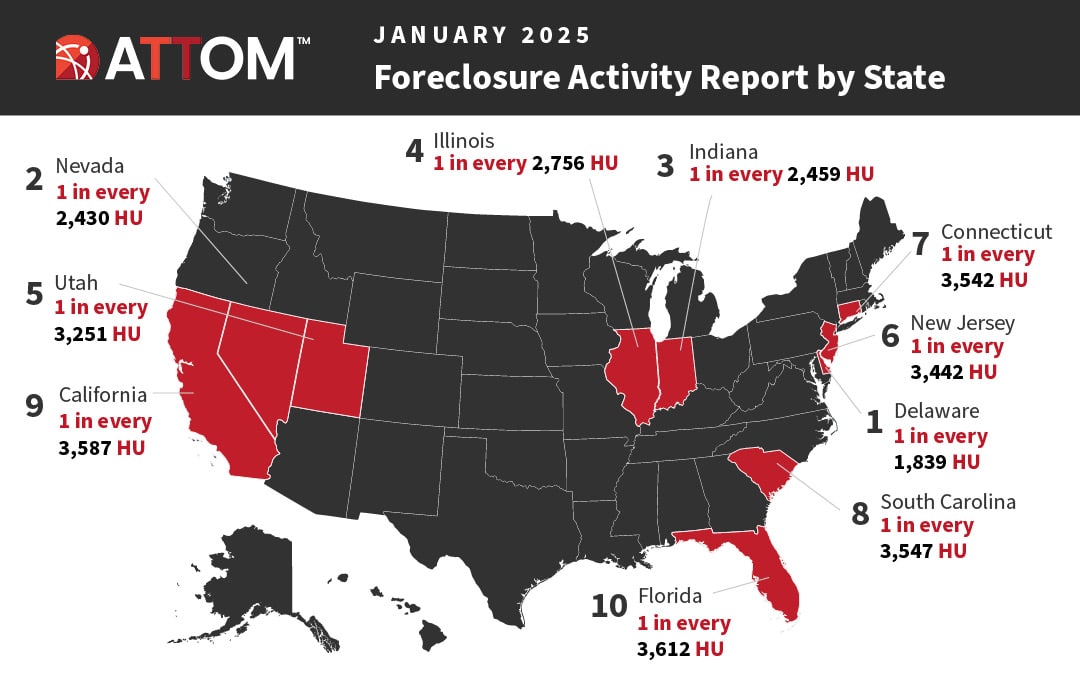
Foreclosure rates rose slightly from December but stayed lower than a year ago. Below is the state-by-state ranking, starting with the highest foreclosure rates.
- Delaware – 1 in every 1,839 housing units (249 filings)
Counties: New Castle, Kent, Sussex - Nevada – 1 in every 2,430 (538 filings)
Counties: Clark, Mineral, Lyon - Indiana – 1 in every 2,459 (1,201 filings)
Counties: Perry, Benton, Lake - Illinois – 1 in every 2,756 (1,975 filings)
Counties: Hardin, Cumberland, Mason - Utah – 1 in every 3,251 (367 filings)
Counties: Cache, Millard, Sanpete - New Jersey – 1 in every 3,442 (1,097 filings)
Counties: Cumberland, Camden, Gloucester - Connecticut – 1 in every 3,542 (432 filings)
Counties: New London, Hartford, Windham - South Carolina – 1 in every 3,547 (677 filings)
Counties: Kershaw, Darlington, Dorchester - California – 1 in every 3,587 (4,051 filings)
Counties: Lake, Madera, San Bernardino - Florida – 1 in every 3,612 (2,791 filings)
Counties: Charlotte, Dixie, Lake - Michigan – 1 in every 3,972 (1,158 filings)
Counties: Saint Joseph, Gratiot, Newaygo - Texas – 1 in every 4,199 (2,832 filings)
Counties: Liberty, Armstrong, Crosby - Iowa – 1 in every 4,222 (338 filings)
Counties: Benton, Cherokee, Keokuk - Maryland – 1 in every 4,250 (599 filings)
Counties: Kent, Somerset, Caroline - Oklahoma – 1 in every 4,290 (411 filings)
Counties: Okfuskee, Logan, Tulsa - Louisiana – 1 in every 4,363 (480 filings)
Counties: Orleans, Arcadia, Vermilion - Ohio – 1 in every 4,419 (1,193 filings)
Counties: Columbiana, Knox, Shelby - Alabama – 1 in every 4,542 (510 filings)
Counties: Perry, Bullock, Coffee - Pennsylvania – 1 in every 4,555 (1,269 filings)
Counties: Delaware, Philadelphia, Northumberland - Arizona – 1 in every 4,683 (671 filings)
Counties: Graham, Pinal, Cochise - North Carolina – 1 in every 5,344 (901 filings)
Counties: Hertford, Chowan, Gates - New York – 1 in every 5,689 (1,501 filings)
Counties: Tioga, Washington, Orange - Rhode Island – 1 in every 5,839 (83 filings)
Counties: Washington, Providence, Kent - Massachusetts – 1 in every 5,888 (512 filings)
Counties: Hampden, Worcester, Franklin - Arkansas – 1 in every 6,200 (223 filings)
Counties: Jackson, Hot Spring, Greene - Minnesota – 1 in every 6,315 (399 filings)
Counties: Rock, Norman, Jackson - Georgia – 1 in every 6,536 (686 filings)
Counties: Charlton, Peach, Harris - New Mexico – 1 in every 6,831 (139 filings)
Counties: San Juan, Torrance, Roosevelt - Wyoming – 1 in every 6,878 (40 filings)
Counties: Campbell, Bighorn, Carbon - Maine – 1 in every 7,043 (106 filings)
Counties: Somerset, Waldo, Washington - Kentucky – 1 in every 7,338 (274 filings)
Counties: Breathitt, Owen, Lincoln - Colorado – 1 in every 7,783 (327 filings)
Counties: Morgan, Bent, Huerfano - Tennessee – 1 in every 7,857 (394 filings)
Counties: Houston, Fentress, Campbell - Washington – 1 in every 7,862 (415 filings)
Counties: Mason, Cowlitz, Pierce - New Hampshire – 1 in every 8,477 (76 filings)
Counties: Cheshire, Coos, Hillsborough - Virginia – 1 in every 8,579 (426 filings)
Counties: Craig, Emporia City, Bath - Idaho – 1 in every 8,927 (87 filings)
Counties: Washington, Custer, Clearwater - Missouri – 1 in every 9,272 (303 filings)
Counties: Madison, Stoddard, Monroe - Alaska – 1 in every 9,380 (34 filings)
Counties: Sitka, Dillingham, Ketchikan Gateway - North Dakota – 1 in every 9,612 (39 filings)
Counties: Renville, McIntosh, Stark - Wisconsin – 1 in every 9,966 (276 filings)
Counties: Iron, Trempealeau, Langlade - Hawaii – 1 in every 10,088 (56 filings)
Counties: Honolulu, Maui, Hawaii - Oregon – 1 in every 10,102 (182 filings)
Counties: Klamath, Columbia, Josephine - Nebraska – 1 in every 10,186 (84 filings)
Counties: Greeley, Cheyenne, Scotts Bluff - West Virginia – 1 in every 11,164 (77 filings)
Counties: Wetzel, Hancock, Preston - Kansas – 1 in every 13,529 (95 filings)
Counties: Morton, Harper, Allen - Vermont – 1 in every 16,051 (21 filings)
Counties: Grand Isle, Orleans, Bennington - Mississippi – 1 in every 17,537 (76 filings)
Counties: Quitman, Sunflower, Adams - Montana – 1 in every 24,902 (21 filings)
Counties: Sheridan, Sanders, Blaine - South Dakota – 1 in every 56,986 (7 filings)
Counties: Minnehaha, Pennington, Brown
What Does This Mean for the Housing Market?
- Foreclosure rates remain historically low but are showing regional increases.
- Economic conditions in 2025 — including mortgage rates and job stability — will determine whether filings stay stable or trend upward.
- Certain states like Delaware, Nevada, and Indiana are experiencing higher-than-average foreclosure activity compared to the national baseline.
Conclusion: While the January 2025 foreclosure bump may be seasonal, monitoring high-activity states can provide early signals of market stress.
Explore ATTOM’s Foreclosure Data
ATTOM’s Foreclosure Data covers default notices, scheduled auctions, and bank repossessions across the U.S. — with historical trends and county-level granularity.
This data helps lenders, investors, and analysts evaluate loan default trends, assess market risk, and identify investment opportunities.
See the latest monthly foreclosure rates by state.

