Geospatial data and analysis are becoming increasingly sophisticated and are serving a broader market. Geospatial data is locational data captured from satellites and aerial imagery presented visually and accurately on maps. Layers of data can be added to visual maps to illustrate land use, demographic information, home values and more, or to determine whether a particular area is comprised of housing, parkland, or retail parks.
Now, ATTOM has created an additional layer of geospatial data called ‘Building Footprints.’ These data show the exact footprint or measurement of a building and how it is located relative to other nearby structures. ATTOM’s Building footprints is a geospatial analysis valuable to retail, insurance, urban planning, telecommunications, home service industries, and many more industries.
Here’s a detailed look at Building Footprints, how the data is sourced, and how the data can be used by various sectors and industries.
What Is a Building Footprint?
To understand what a building footprint is, it helps to first understand what it is not. A building footprint is not a floor plan. The footprint does not include the names, locations, or dimensions of individual rooms within a structure, and the footprint does not tell you where utility lines enter the building.
For retail parks or shopping malls, a building footprint is not part of a mall map. Building Footprints do not depict how large commercial structures like shopping malls are divided into individual stores, nor does it provide tenant information. Instead, Building Footprints depict the outline of the exterior of a mall building, as well as the outlines for any other outbuildings.
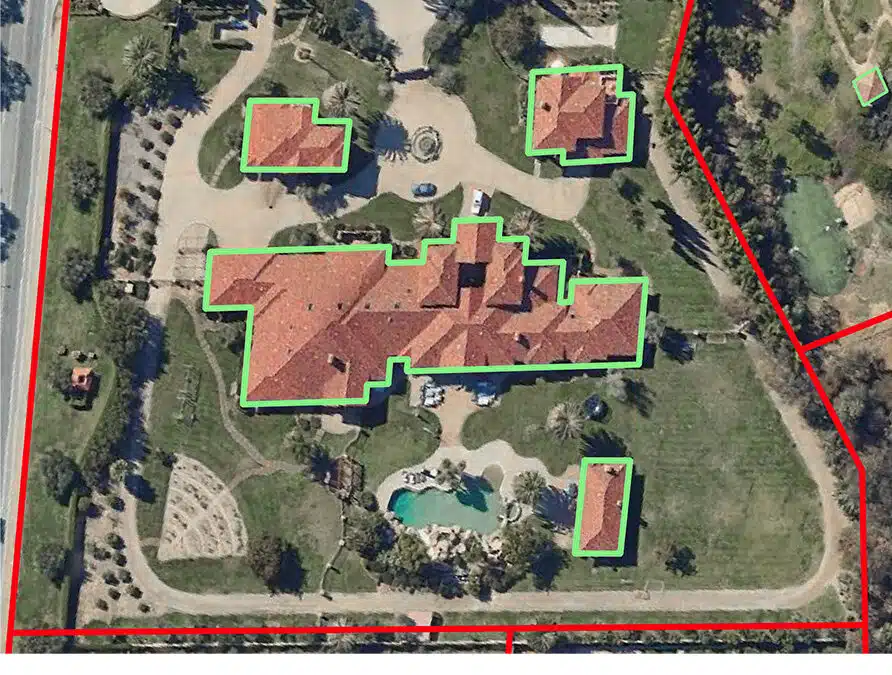
ATTOM’s Building Footprints product creates polygons that accurately map the outline of the exterior of a building. The polygon demarcates the building’s perimeter. As a geospatial tool, Building Footprints convey characteristics such as location, shape, distribution, and relationship to other nearby structures or geographic features.
How Are Building Footprints Created?
ATTOM’s building footprints are created from nationwide aerial imagery and LiDAR, which stands for light detection and ranging. It is a remote sensing method that uses light in the form of a pulsed laser to measure ranges or distances to the Earth. These light pulses generate precise, three-dimensional information about the shape of the Earth and its surface characteristics.
Just as a human can look at aerial imagery and identify buildings, computer algorithms can do the same given enough training data. Algorithms scan the aerial imagery, detect the buildings, and create the Building Footprint polygons, essentially from the outlines of the building roofs.
Additional algorithms then refine the results, removing any undesirable artifacts by regularizing and squaring up the polygons. Finally, in extremely dense urban areas such as Manhattan, where many rooftops run together, parcel boundaries split the building footprints along parcel lines.
Building footprints are obviously useful for urban planning and land use purposes, but they are also extremely useful for real estate and insurance underwriting.
Building Footprints for Real Estate and Property Characteristics
Another use case for Building Footprints is for display on property search websites. Traditionally, websites either use a pin or a parcel boundary to identify properties, and when a user hovers over or clicks on that pin or parcel boundary, additional property characteristics such as assessor and tax info are displayed.
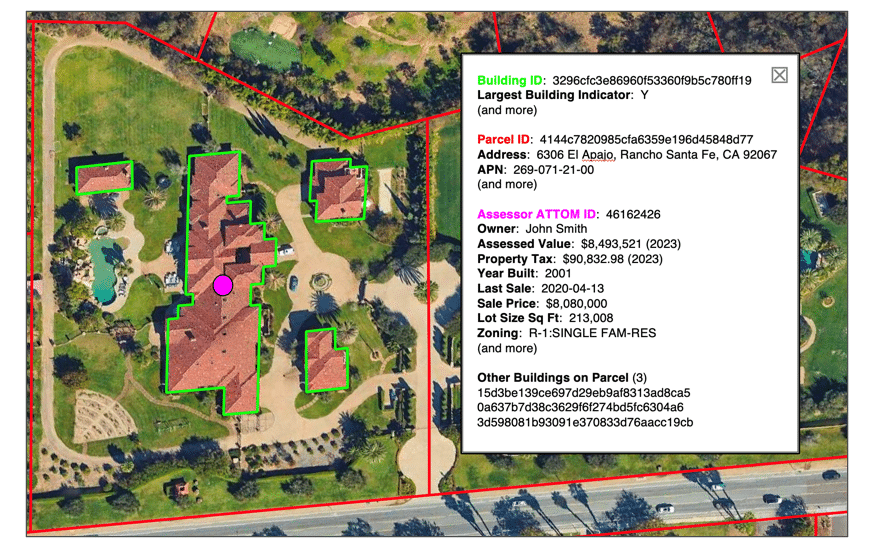
Building Footprints can also be used in this manner. The image below shows a parcel boundary in red. The parcel boundary contains four buildings, depicted by the green polygons, and the magenta assessor point. The largest building on the property is the primary residence. The image shows the Building Footprints and another layer of data, which is the address, APN, assessor, and tax information.
Building Footprints – Ensuring Superior Insurance Underwriting
Highly accurate Building Footprints are extremely important for insurers that seek accurate assessments of the risk from flood, wildfire, nearby trees, and other hazards. Assessors often use geocodes or street-level geocodes, but these are much less accurate and can lead to under and over-pricing of insurance policies.
Under-Pricing of Property Insurance Policies Using Traditional Geo-Location Data
Historically, flood risk has been determined by taking the flood zone boundary, which is displayed in blue, and comparing it to a property geocode.

In many instances, the insurers geocode for a property may be located in the center of a parcel; that is, a parcel centroid geocode. The parcel centroid geocode is shown in the visual above as a red dot. The parcel boundary itself is the red polygon. In this case, the property would incorrectly be underwritten as lower risk because the less accurate parcel centroid geocode does not fall within the blue flood zone.
However, in reality, the house is located on the eastern end of the parcel, depicted here by the green building footprint, and it actually does fall within the flood zone. In this case, the house would be high risk, but the insurer would underprice the underwriting if they were using the parcel centroid geocode. Ultimately, across an entire book of business, this inaccurate risk assessment would expose the insurer to higher unforeseen flood claims.
Similarly, using geocodes can lead to over-pricing for underwriting.
Over-Pricing of Property Insurance Polices Using Traditional Geo-Location Data

In the image above, if the insurer were to use parcel centroid geocodes, again depicted as red dots, the determination would be that these homes DO fall within the blue flood zone. However, in reality, the homes, depicted as the green building footprint polygons, are located at the edge of the parcel, far up the hill from the creek that runs near the back of the parcels.
These building footprints don’t fall within the flood zone at all. Using the lower-accuracy parcel centroid geocodes, these policies would be overpriced. Policyholders might be inclined to switch to another insurer that would price them lower and not consider them within the flood zone.
How Building Footprints Incorporate Key Surrounding Factors for Risk Assessments
Building Footprints aid insurers because they include all the factors linked to risk assessment. Take wildfire risk, for example. Additional risk factors for fire are the number and location of nearby buildings, as well as the presence of nearby trees or brush.
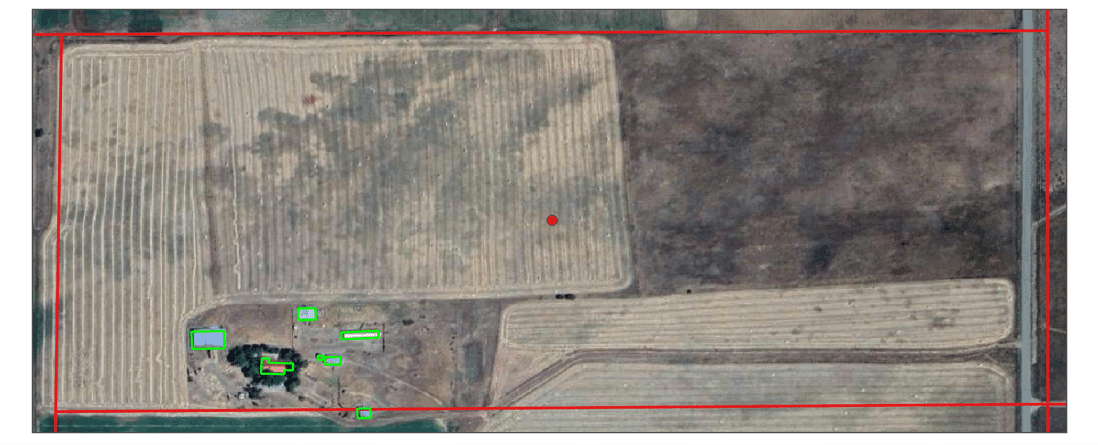
The image below shows a large parcel depicted by the red polygon. Again, if an insurer is using the red parcel centroid geocode dot to evaluate wildfire risk, they may consider this property to be fairly low risk because the parcel centroid falls in the middle of an empty field.
However, Building Footprints shows a number of buildings located on the property, depicted by the green building footprints, in very close proximity to one other. Also, there are trees and brush surrounding the primary residence. For these reasons, the property is far from low risk and should be assessed as having a high risk for wildfire.
Building Footprints for Investors, Government Entities, and Utilities
Among the many use cases for building footprints, wildfire and other hazard risk assessments can benefit from this data, which offers improved accuracy and cost effectiveness.
Solar energy firms use Building Footprints to estimate solar power potential for rooftop solar panel arrays, while Telecom Companies use Building Footprints to better estimate deployment costs, optimize service areas, understand building density and individual building size, and prioritize new areas for deploying access.
Building Footprints can also be used in property development to identify new opportunities for residential or commercial sites.
Local Governments use Building Footprints to identify development constraints, assess property sale values, understand urban growth, and plan for electric vehicle charging stations and street lighting.
ATTOM’s Building Footprints links to other data such as parcel boundaries, assessor, recorder, foreclosures, automated valuation models (AVM), building permits, and other property products. Whatever the intended use, ATTOM has the data.
Get Sample Building Footprints Data Right Away – Contact a Data Expert Now