
According to ATTOM’s Q1 2023 U.S. Home Flipping Report, there were 72,960 U.S. single-family homes and condos flipped in the first quarter, representing 9 percent of all sales. That figure was down from 9.4 percent of all home sales in Q1 2022, but still up from 8 percent in Q4 2022 – hitting the second-highest level this century.
ATTOM’s latest home flipping analysis revealed that while flipping activity rose, mixed trends emerged for raw profits and profit margins. The report noted that profits and investment returns both increased slightly from Q4 2022 to Q1 2023, but both figures remained near low points over the past decade.
The Q1 2023 report also noted that among flips nationwide, the gross profit on typical transactions increased to $56,000 in Q1 2023. That figure remained down 20 percent from $70,000 in Q1 2022 and still stood at one of the lowest points since the U.S. housing market began recovering in 2012 from the Great Recession in the late 2000s. Also according to the report, the total profit of typical flips nationwide was up 4.7 percent from $53,500 in Q4 2022.
The analysis also found that the typical gross flipping profit of $56,000 in Q1 2023 translated into a 22.5 percent ROI compared to the original acquisition price. The report noted that while the typical margin remained down from 26.9 percent in Q1 2022 – and was still less than half of the 51.5 percent level recorded in the middle of 2020 – it inched up from 21.7 percent in Q4 2022.
ATTOM’s Q1 2023 flipping report also stated that home flips as a portion of all home sales increased from Q4 2022 to Q1 2023 in 74 percent of U.S. metro areas analyzed. According to the report, the increases were mostly by less than two percentage points. (Metro areas were included in the analysis if they had a population of 200,000 or more and at least 50 home flips in Q1 2023).
The latest analysis also found that among those metros, the largest flipping rates in Q1 2023 were in Macon, GA (flips comprised 16.8 percent of all home sales); Atlanta, GA (15.3 percent); Jacksonville, FL (15.2 percent); Memphis, TN (14.4 percent) and Clarksville, TN (14.3 percent).
ATTOM’s latest report noted that home flips accounted for at least 10 percent of all home sales in 36 percent of U.S. counties analyzed in Q1 2023. The report noted that was well above the 21 percent figure in Q4 2022. Among counties with 10 or more home flips in Q1 2023, those with the highest home flipping rates included: Baker County, FL (outside Jacksonville) (22.7 percent); Cobb County (Marietta), GA (21.5 percent); Douglas County, GA (outside Atlanta) (21 percent); Cannon County, TN (east of Nashville) (19.2 percent) and Paulding County, GA (outside Marietta) (19.2 percent).
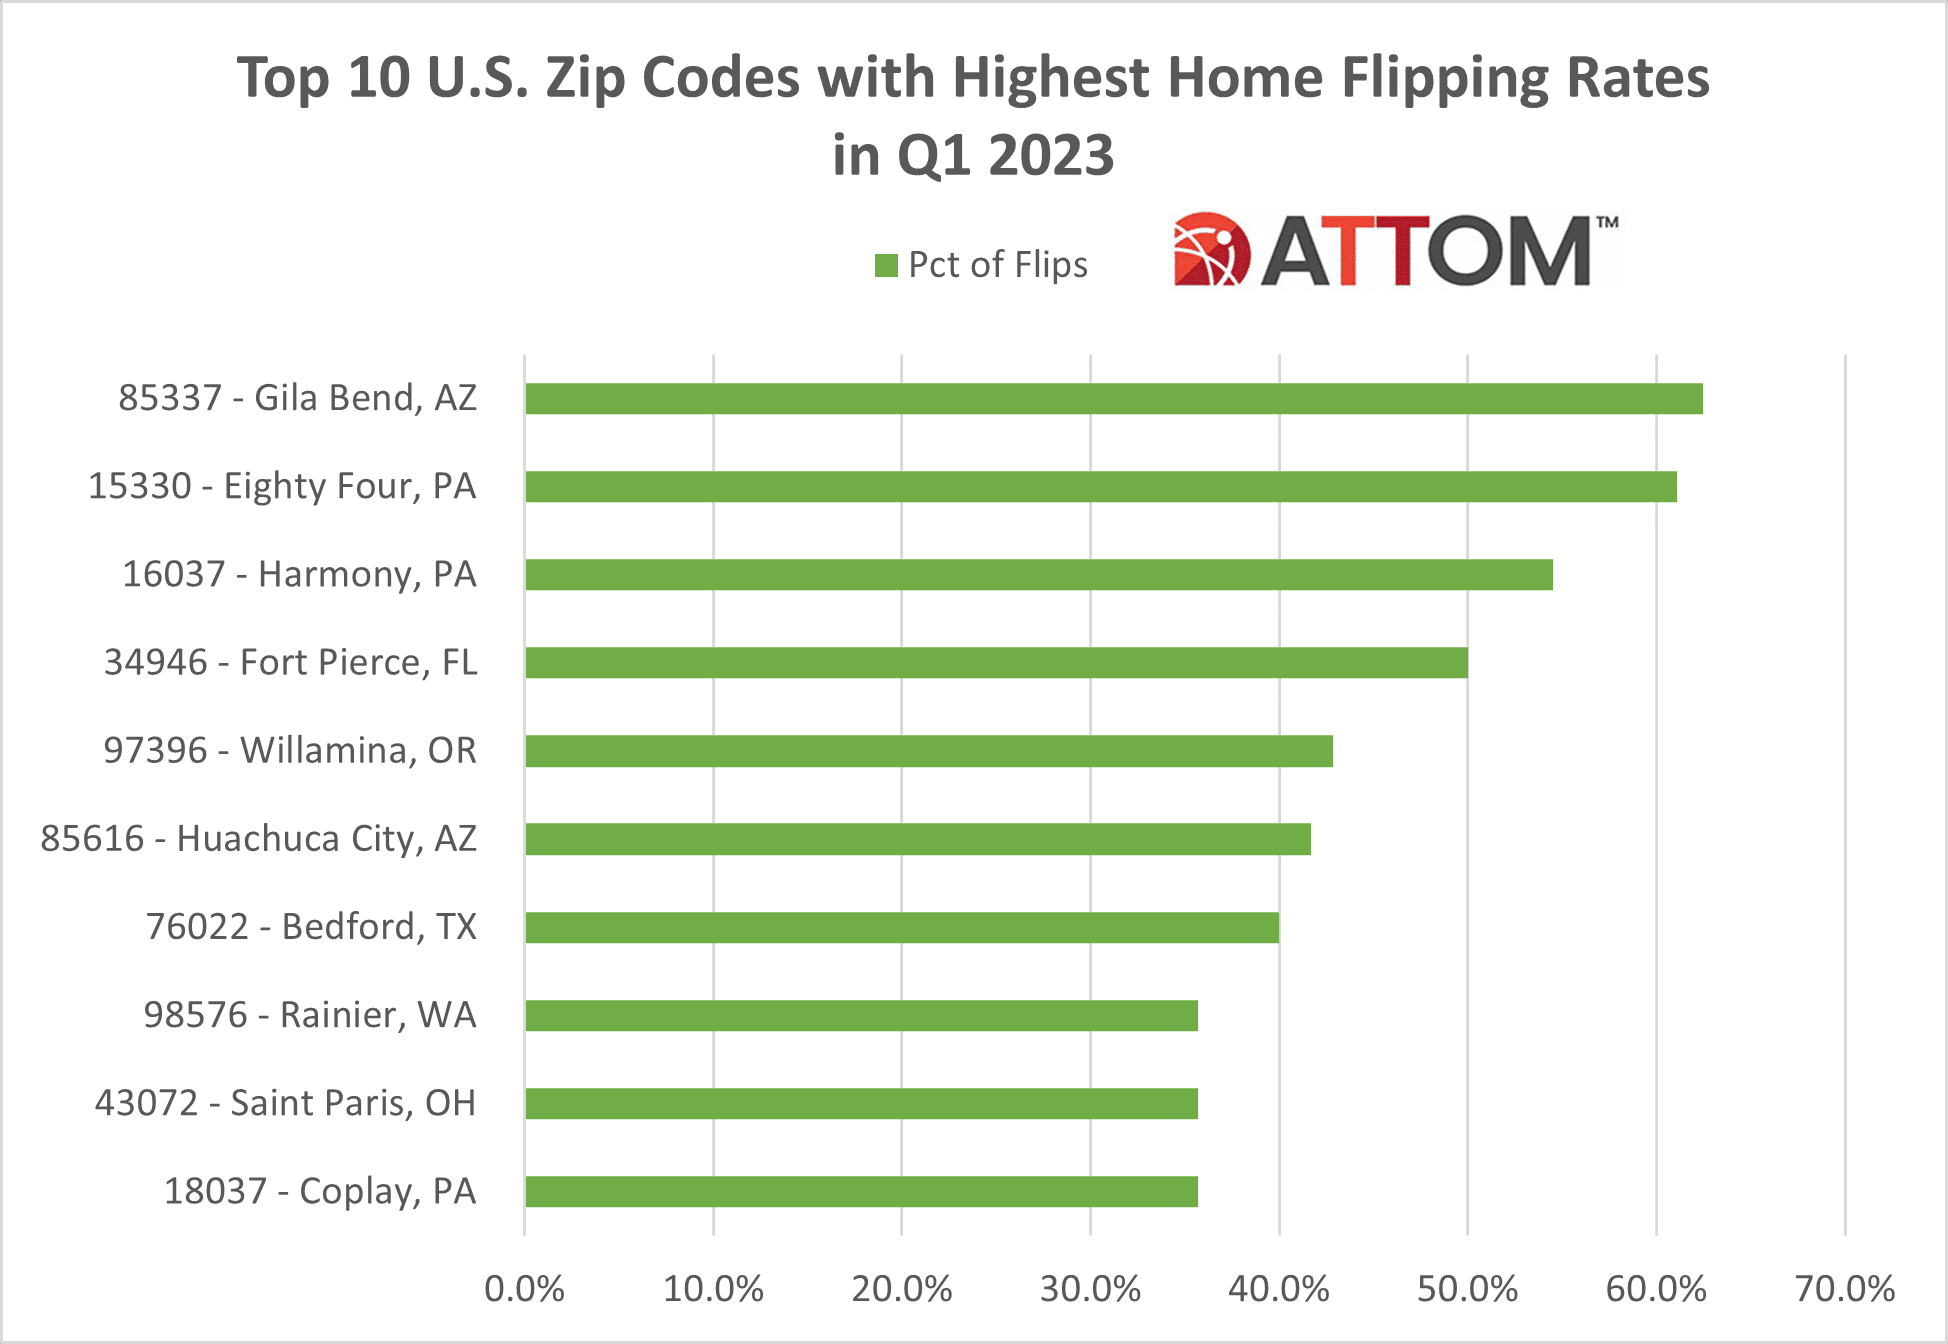
In this post, we dive deep into the data behind ATTOM’s latest U.S. Home Flipping Report to uncover those top 10 zip codes with the highest home flipping rates in Q1 2023. Among those ZIPS with 5 or more home flips in the first quarter, those with the highest flipping rates include: 85337 in Gila Bend, AZ (62.5 percent); 15330 in Eighty Four, PA (61.1 percent); 16037 in Harmony, PA (54.5 percent); 34946 in Fort Pierce, FL (50.0 percent); 97396 in Willamina, OR (42.9 percent); 85616 in Huachuca City, AZ (41.7 percent); 76022 in Bedford, TX (40.0 percent); 18037 – Coplay, PA (35.7 percent); 43072 in Saint Paris, OH (35.7 percent); and 98576 in Rainier, WA (35.7 percent).
Want to learn more about home flipping trends in your area? Contact us to find out how!
