
Flipping Rate Across U.S. Rises Close to High Point This Century; Typical Profit Margins Inch Up but Still Near Lowest Level Since 2000; Raw Profits Remain Near 10-Year Low
IRVINE, Calif. – June 22, 2023 — ATTOM, a leading curator of land, property, and real estate data, today released its first-quarter 2023 U.S. Home Flipping Report showing that 72,960 single-family homes and condominiums in the United States were flipped in the first quarter. Those transactions represented 9 percent of all sales.
The latest portion was down from 9.4 percent of all home sales in the nation during the first quarter of 2022. But it was still up from 8 percent in the fourth quarter of last year, hitting the second-highest level this century.
The report also revealed that while flipping activity rose, mixed trends emerged for raw profits and profit margins. Profits and investment returns both increased slightly from the fourth quarter of 2022 to the first quarter of this year. But both also remained near low points over the past decade, reflecting ongoing financial struggles for home flippers.
The quarterly gain in the typical profit margin, of 22 percent, represented a modest reversal of fortune for investors following three years of nearly continuous declines that began well before a slowdown in the broader U.S. housing market last year.

“Home-flipping investors across the U.S. may have finally halted the decline,” said Rob Barber, CEO of ATTOM. “In the first quarter, profit margins showed a slight upward turn after an extended slump, while interest in flipped homes continued to rise among buyers. However, investors shouldn’t assume they’re out of the woods just yet. Home-flipping carrying costs can easily erase a 22 percent return on gross profits, and it’s possible that the recent gain is merely a temporary blip. Nevertheless, the first-quarter trends offer some hope for investors indicating that brighter times may lie ahead.”
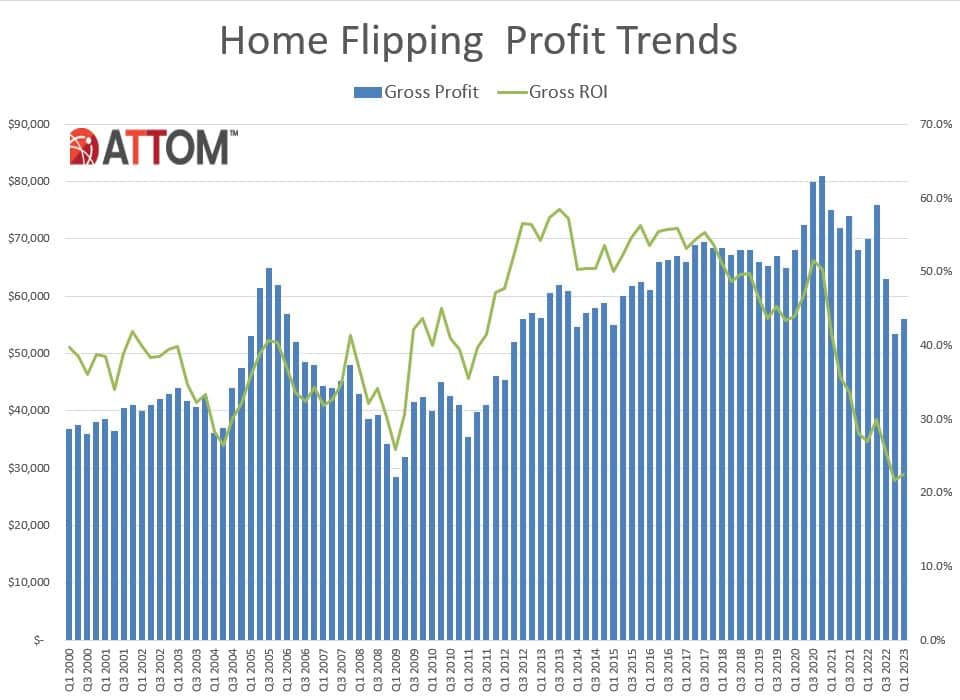
Among flips nationwide, the gross profit on typical transactions (the difference between the median purchase price paid by investors and the median resale price) increased to $56,000 in the first quarter of 2023. That remained down 20 percent from $70,000 in the first quarter of 2022 and still stood at one of the lowest points since the U.S. housing market began recovering in 2012 from the Great Recession that struck in the late 2000s. Nevertheless, the total profit of typical flips nationwide was up 4.7 percent from $53,500 in the fourth quarter of 2022.
Typical profit margins, meanwhile, also ticked up during the first few months of this year, after falling in eight of the prior nine quarters.
The typical gross flipping profit of $56,000 in the first quarter of 2023 translated into a 22.5 percent return on investment compared to the original acquisition price. While the typical margin remained down from 26.9 percent in the first quarter of 2022 – and was still less than half of the 51.5 percent level recorded in the middle of 2020 – it inched up from 21.7 percent in the fourth quarter of last year.
Profits and profit margins turned around a bit in the first quarter of 2023 as median resale prices on flipped homes went up slightly faster than they were rising when investors were buying homes.
Specifically, in the first quarter of 2023, the typical resale price on flipped homes increased 1.7 percent, from $300,000 in the fourth quarter of 2022 to $305,000 in the first quarter of this year. That was better than the 1 percent increase in the median price that recent home flippers were commonly seeing when they originally bought their properties.
The recent profit turnaround – modest as it was – continued an unusual pattern of home flipping fortunes running counter to the broader U.S. housing market. For the prior three years, investment returns were mostly dropping. That was happening despite prices and profits for traditional sellers soaring during an extended, decade-long boom period for the overall market.
Investor woes continued last year as the market surge stalled amid rising mortgage rates, high consumer price inflation, a faltering stock market and economic uncertainty. Home values have dropped throughout the country since the second quarter of last year, with the national median price down 7 percent. But flipping profits started to reverse course early this year, even as prices continued to dip in most of the country.
Home flipping rates rise in three-quarters of nation
Home flips as a portion of all home sales increased from the fourth quarter of 2022 to the first quarter of 2023 in 128 of the 172 metropolitan statistical areas around the U.S. with enough data to analyze (74 percent). The increases were mostly by less than two percentage points. (Metro areas were included if they had a population of 200,000 or more and at least 50 home flips in the first quarter of 2023).
Among those metros, the largest flipping rates during the first quarter of 2023 were in Macon, GA (flips comprised 16.8 percent of all home sales); Atlanta, GA (15.3 percent); Jacksonville, FL (15.2 percent); Memphis, TN (14.4 percent) and Clarksville, TN (14.3 percent).

Aside from Atlanta, Jacksonville and Memphis, the largest flipping rates among metro areas with a population of more than 1 million were in Phoenix, AZ (13.9 percent) and Charlotte, NC (13.2 percent).
The smallest home-flipping rates among metro areas analyzed in the first quarter were in Indianapolis, IN (4 percent); Wichita, KS (5 percent); Bridgeport, CT (5 percent); Madison, WI (5.2 percent) and South Bend, IN (5.3 percent).
Typical home flipping returns up quarterly in over half the nation
The median $305,000 resale price of homes flipped nationwide in the first quarter of 2023 generated a gross profit of $56,000 above the median investor purchase price of $249,000. That resulted in a typical 22.5 percent profit margin, up from 21.7 percent in the fourth quarter of 2022.
Profit margins went up quarterly in 103 of the 172 metro areas analyzed (60 percent), although they were still below levels from the first quarter of 2022 in 132, or 77 percent, of those markets.
Some of the biggest quarterly increases in the typical profit margin during the early months of 2023 came in Shreveport, LA (ROI up from 38.6 percent in the fourth quarter of 2022 to 92 percent in the first quarter of 2023); Lafayette, LA (up from 25.5 percent to 72.8 percent); Savannah, GA (up from 14.3 percent to 56.8 percent); South Bend, IN (up from 8.5 percent to 49.4 percent) and Peoria, IL (up from 40.7 percent to 75.7 percent).
Despite the quarterly gains, typical flipping profits remained less than 30 percent in 81 of the 172 metros with enough data to analyze in the first quarter of 2023 (47 percent). That was slightly better than the level in the fourth quarter of last year. But it still was worse than the level of a year earlier, when profit margins on median-priced home flips fell below 30 percent in just a third of those metro areas. Three years ago, typical investment returns were that low in only a quarter of the same metro areas.
Markets with the largest returns on investment for typical home flips completed during the first quarter of 2023 were Scranton, PA (121.9 percent return); Pittsburgh, PA (109.8 percent); Flint, MI (94.9 percent); Shreveport, LA (92 percent) and New Orleans, LA (84.6 percent).
Aside from Pittsburgh and New Orleans, the largest investment returns in the first quarter among metro areas with a population of at least 1 million were in Philadelphia, PA (78.8 percent); Baltimore, MD (69.9 percent) and Detroit, MI (68.6 percent).
Metro areas with the weakest returns on typical home flips in the first quarter of 2023 were Austin, TX (10.2 percent loss); Phoenix, AZ (2.4 percent loss); Ogden, UT (0.5 percent loss); Las Vegas, NV (0.3 percent loss) and Boise, ID (0.8 percent profit).
Investors continue to earn highest raw profits in South and Northeast
The highest raw profits on median-priced home flips in the first quarter of 2023, measured in dollars, remained concentrated in the South and Northeast regions of the country. Eighteen of the top 20 were in those regions, led by Bridgeport, CT (typical gross profit of $171,000); Boston, MA ($157,000); New York, NY ($144,374); San Jose, CA ($140,000) and Worcester, MA ($135,000).
The South also dominated the opposite end of the range, along with the West, with 18 of the 20 lowest raw profits located in those regions. The weakest numbers were in Austin, TX ($51,550 loss); Phoenix, AZ ($9,963 loss); Ogden, UT ($2,115 loss); Las Vegas, NV ($1,300 loss) and Raleigh, NC ($3,250 profit).
All-cash investing still comprising two-thirds of flipping market
Nationwide, 66.1 percent of homes flipped in the first quarter of 2023 had been purchased by investors with cash. That was virtually unchanged from the 66 percent level in the fourth quarter of 2022 and the 65.7 percent portion in the first quarter of 2022. Meanwhile, 33.9 percent of homes flipped in the first quarter of 2023 had been bought with financing. That was about the same as in the prior quarter (34 percent) and a year earlier (34.3 percent).
Among metropolitan areas with a population of 1 million or more and sufficient data to analyze, those with the highest percentage of flips in the first quarter of 2023 that had been purchased with cash were in Detroit, MI (86.2 percent); Buffalo, NY (81.9 percent); Birmingham, AL (78.4 percent); Cleveland, OH (77.2 percent) and Charlotte, NC (76.6 percent).
Average time to flip nationwide increases
The average time it took from purchase to resale on home flips rose to 178 days in the first quarter of 2023, up from 165 in the fourth quarter of 2022 and 163 days in the first quarter of 2022.

Investor resales to FHA buyers up again
Of the 72,960 U.S. homes flipped in the first quarter of 2023, 11 percent were sold to buyers using loans backed by the Federal Housing Administration (FHA), marking the third straight quarterly gain. The latest portion was up from 9.8 percent in the prior quarter and 7.8 percent a year earlier.
Among metro areas with a population of at least 200,000 and at least 50 home flips in the first quarter of 2023, those with the highest percentage of flipped properties sold to FHA buyers — typically first-time home purchasers — were Modesto, CA (32 percent); Bakersfield, CA (25.7 percent); Visalia, CA (24.4 percent); Stockton, CA (23.8 percent) and Lakeland, FL (22.2 percent).
One-third of counties have home-flipping rates of at least 10 percent
Home flips accounted for at least 10 percent of all home sales in 336, or 36 percent, of the 932 counties around the U.S. with at least 10 flips in the first quarter of 2023. That was well above the 21 percent portion of all counties with enough data to measure in the fourth quarter of 2022. The leaders in the first quarter of this year were Baker County, FL (outside Jacksonville) (22.7 percent); Cobb County (Marietta), GA (21.5 percent); Douglas County, GA (outside Atlanta) (21 percent); Cannon County, TN (east of Nashville) (19.2 percent) and Paulding County, GA (outside Marietta) (19.2 percent).
Report methodology
ATTOM analyzed sales deed data for this report. A single-family home or condo flip was any arms-length transaction that occurred in the quarter where a previous arms-length transaction on the same property had occurred within the last 12 months. The average gross flipping profit is the difference between the purchase price and the flipped price (not including rehab costs and other expenses incurred, which flipping veterans estimate typically run between 20 percent and 33 percent of the property’s after-repair value). Gross flipping return on investment was calculated by dividing the gross flipping profit by the third sale (purchase) price.
About ATTOM
ATTOM delivers AI-driven property intelligence built on one of the nation's most trusted property data assets, covering 160 million U.S. properties—99% of the population. Our engineered, multi-sourced real estate data spans property tax, deeds, mortgages, foreclosure, environmental risk, property conditions, natural hazards, neighborhood insights, and geospatial boundaries, rigorously validated for advanced analytics. ATTOM supports analytics and AI-driven applications through flexible delivery options including APIs, bulk licensing, cloud delivery, and the MCP Server for AI-powered, agentic access to engineered property data—enabling organizations to automate analysis and scale property intelligence across industries.
Media Contact:
Christine Stricker
949.748.8428
christine.stricker@attomdata.com
Data and Report Licensing:
949.502.8313
