
With the ATTOM Data Solutions recently released Q2 2019 Home Sales Report, the typical Spring-season price surge was shown to be stronger than usual, with the biggest quarterly gain in three years. The seller profits margins also jumped at one of the fastest rates since 2015, reaching new post-recession highs.
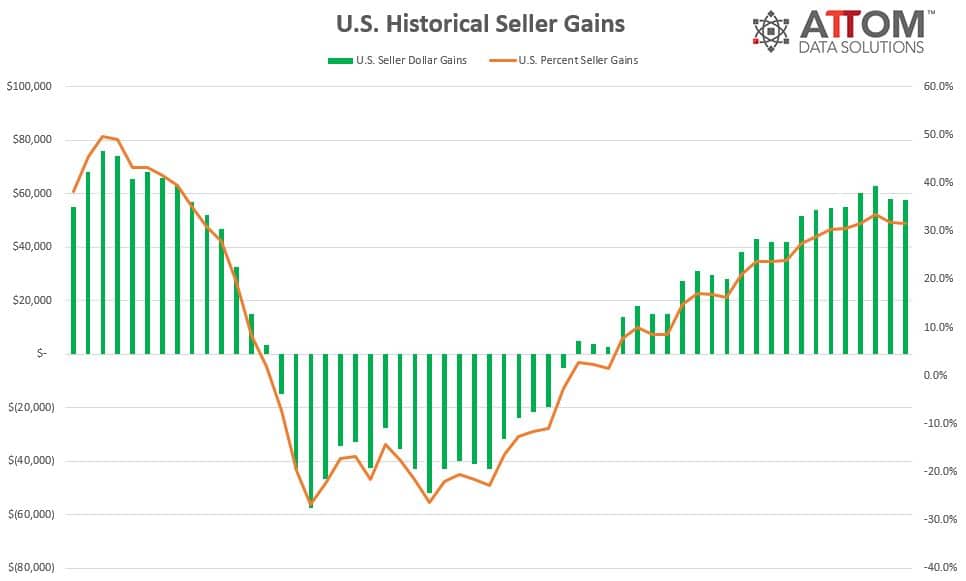
A look at the national numbers, showed that U.S. homeowners who sold in the second quarter of 2019 realized an average home price gain since the original purchase of $67,500, up from an average gain of $57,706 in Q1 2019 and up from an average gain of $60,100 in Q2 2018. The average home seller gain of $67,500 in Q2 2019 represented an average 33.9 percent return as a percentage of original purchase price. For a detailed home sales data analysis, click here.
The data is derived by looking at what a homeowner originally paid on their property versus what they sold it for. If you are interested in a more historical overview, check out the chart below. Most of ATTOMs datasets stretch back to 2005 and beyond and can also drill down to various geography levels, just contact us to find out how.
Top 10 Markets with Greatest Dollar Gains
It’s not surprise that the greatest dollar gains will occur in areas where home prices are steadily increasing. However, just what areas are those? ATTOM decided to do a deep data dive and help uncover those markets where home seller gains are well above the nation.
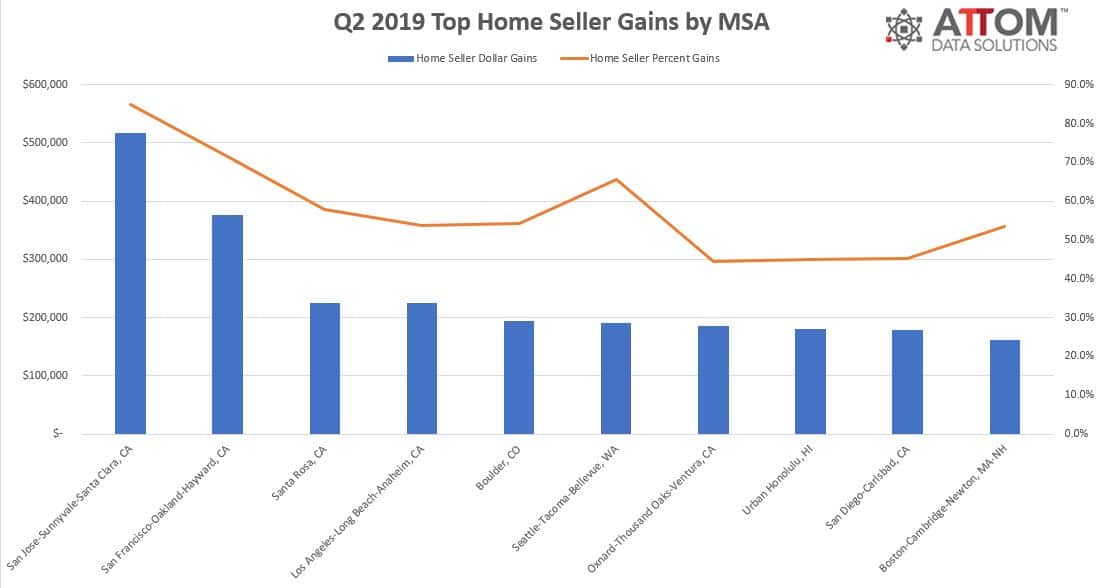
ATTOM Data wanted to showcase those markets, where home sellers are gaining the most on their homes. Among 149 metropolitan statistical areas analyzed in the report, those with the highest average home seller dollar gains in Q2 2019 were San Jose, California ($517,000); San Francisco, California ($376,000); Santa Rosa, California ($225,500); Los Angeles, California ($224,500); and rounding out the top 5 is a non-California area – Boulder, Colorado ($194,741).
Want More Data?
Don’t see your market or want to drill down further? Want to unlock possible trends in the market or need the data historically going back monthly or annually? Contact ATTOM now to find out how!
