
U.S. Average Homeownership Tenure Dips to 8.05 Years and Posts Biggest Annual Increase Since Q4 2015; Denver, Austin, Dallas and Nashville Sales Prices 50+ Percent Above Pre-Recession Peaks
IRVINE, Calif. – April 25, 2019 — ATTOM Data Solutions, curator of the nation’s premier property database and first property data provider of Data-as-a-Service (DaaS), today released its Q1 2019 U.S. Home Sales Report, which shows that homeowners who sold in the first quarter realized an average price gain of $57,500 since purchase, representing an average 31.5 percent return on the purchase price.
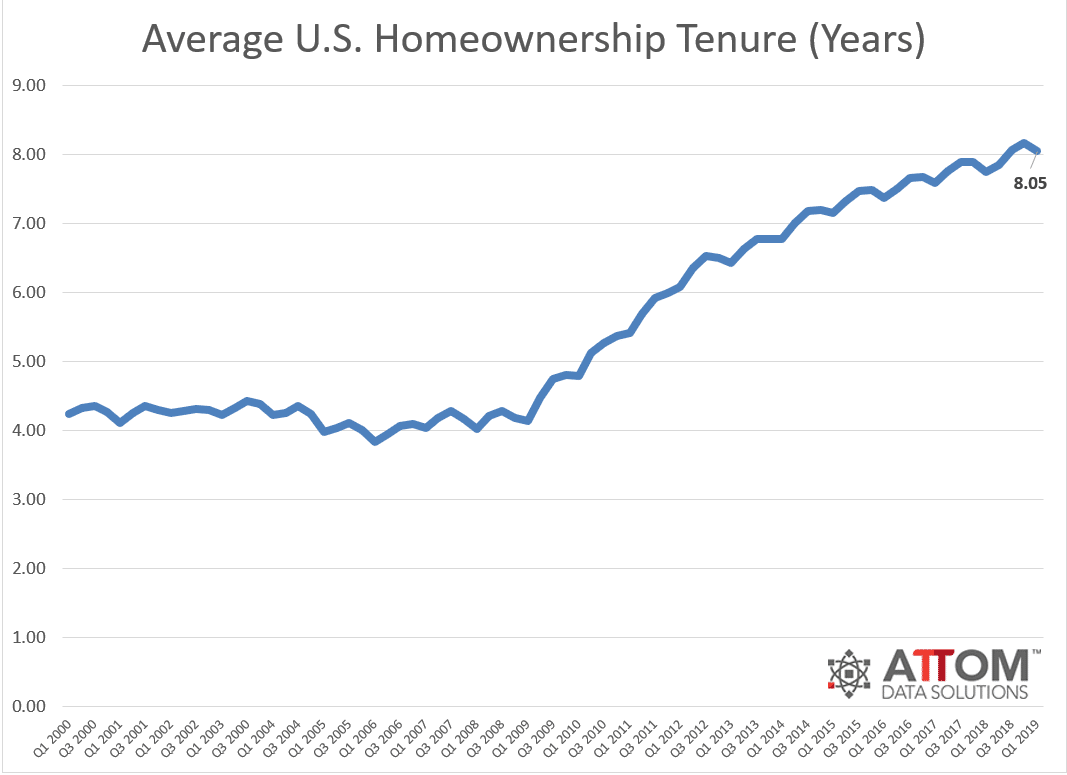
Meanwhile, the report also shows that homeowners who sold in the first quarter had owned an average of 8.05 years, down slightly from a record-high average homeownership tenure of 8.17 years in Q4 2018 but still up from 7.75 years in Q1 2018. Homeownership tenure averaged 4.21 years nationwide between Q1 2000 and Q3 2007, prior to the Great Recession. For a detailed home sales data analysis, click here.
“We are starting to see homes sales prices and profit margins softening for the nation, and the average homeownership tenure did see a slight dip from last quarter,” said Todd Teta, chief product officer at ATTOM Data Solutions. “However, home prices are still above pre-recession peaks in 59 percent of local markets, and as the buying season starts to kick into gear, the next few months may provide even more answers to the question of whether a lasso is indeed around the market or if the recent trend is a temporary bump in the ride.”
Average homeownership tenure down in Kansas City, Tucson, Boston and Orlando
Counter to the national trend, the average homeownership tenure in Q1 2019 decreased from a year ago in 25 of 108 metro areas analyzed in the report (23 percent), including Kansas City, Tucson, Boston, Orlando, and Oklahoma City.
Among major metropolitan areas with a population of at least 1 million, those with the longest average homeownership tenure for home sellers who sold in the first quarter were Hartford, Connecticut (12.52 years); Boston, Massachusetts (12.36 years); Providence, Rhode Island (11.15 years); San Francisco, California (10.40 years); and San Jose, California (10.27 years).
Prices in Denver, Austin, Dallas and Nashville 50+ percent above pre-recession peaks
Median home prices in 73 of the 123 metro areas analyzed in the report (59 percent) were above pre-recession peaks in the first quarter of 2019, led by Greeley, Colorado (79 percent above); Denver, Colorado (68 percent above); Fort Collins, Colorado (67 percent above); Austin, Texas (62 percent above); and Dallas, Texas (58 percent above).
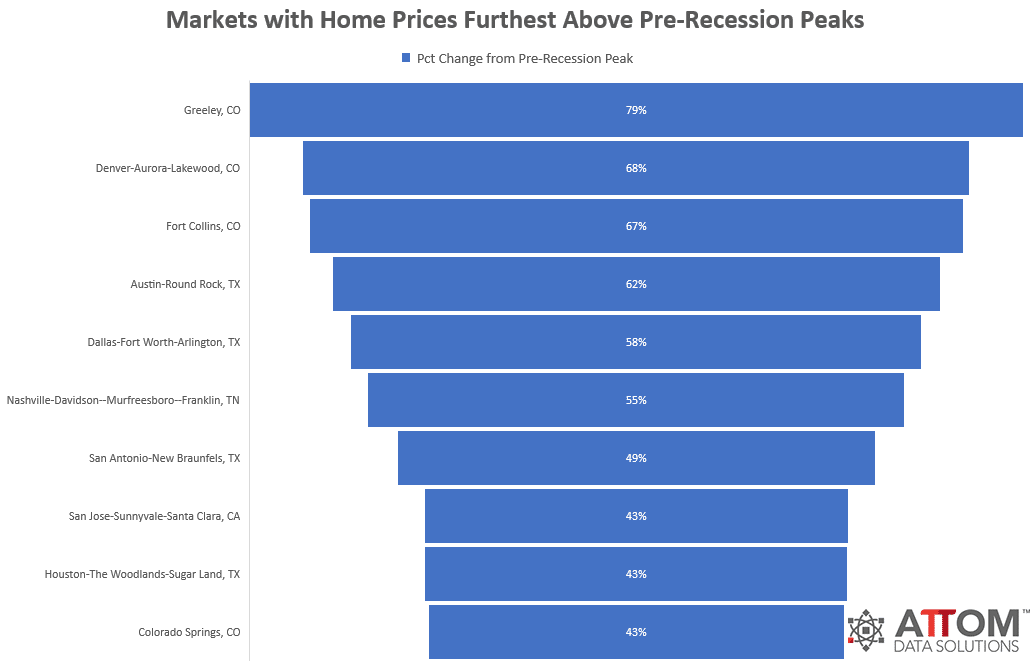
Including Denver, Austin and Dallas, other major metros with at least 1 million people and with Q1 2019 median home prices at least 40 percent above pre-recession peaks were Nashville, Tennessee (55 percent above); San Antonio, Texas (49 percent above); San Jose, California (43 percent above); Houston, Texas (43 percent above); and Kansas City, Missouri (41 percent above).
Prices in Hartford, Philadelphia, Chicago, Miami and D.C. still below pre-recession peaks
Median home prices in 49 of the 123 metro areas analyzed in the report (40 percent) were still below pre-recession peaks in the first quarter of 2019, led by York-Hanover, Pennsylvania (56 percent below); Trenton, New Jersey (35 percent below); Atlantic City, New Jersey (32 percent below); Bridgeport-Stamford-Norwalk, Connecticut (28 percent below); and New Haven, Connecticut (22 percent below).
Those major metros with at least 1 million people and with Q1 2019 median home prices at least 10 percent below pre-recession peaks were Hartford, Connecticut (17 percent below); Philadelphia, Pennsylvania (15 percent below); Chicago, Illinois (14 percent below); Baltimore, Maryland (13 percent below); Miami, Florida (12 percent below); Washington, D.C. (10 percent below); and Birmingham, Alabama (10 percent below).
Average home seller gains down from previous quarter, up from year ago
U.S. homeowners who sold in the first quarter of 2019 realized an average home price gain since purchase of $57,500, down from an average gain of $60,000 in Q4 2018 but up from an average gain of $56,733 in Q1 2018. The average home seller gain of $57,500 in Q1 2019 represented an average 31.5 percent return as a percentage of original purchase price.
Among 123 metropolitan statistical areas analyzed in the report, those with the highest average home seller returns in Q1 2019 were San Jose, California (84.1 percent); San Francisco, California (70.9 percent); Seattle, Washington (63.1 percent); Modesto, California (59.7 percent); and Salt Lake City, Utah (56.5 percent).
Cash sales share decrease annually
All-cash sales represented 28.0 percent of all single family and condo sales in Q1 2019, up from 27.7 percent of all sales in the previous quarter, but down from 28.9 percent of all sales in Q1 2018.
Among major metropolitan areas with a population of at least 1 million, those with the highest share of all-cash sales in Q1 2019 were; Miami (44.6 percent); Tampa-St. Petersburg, Florida (40.7 percent); Birmingham, Alabama (40.6 percent); Detroit (40.1 percent); and Memphis, Tennessee (38.9 percent).
Institutional investor sales share down nationwide, up in 29 percent of local markets
The share of U.S. single family home and condo sales sold to institutional investors (entities buying at least 10 properties in a calendar year) was 1.8 percent in the first quarter, down from 3.7 percent in the previous quarter and down from 2.2 percent a year ago.
Among 49 metropolitan statistical areas with a population of at least 200,000 and at least 40 institutional investor sales in Q1 2019, those with the highest share of institutional investor sales in the first quarter were; Columbia, South Carolina (7.9 percent); Atlanta, Georgia (7.4 percent); Charlotte, North Carolina (5.6 percent); Memphis, Tennessee (5.1 percent); and Las Vegas, Nevada (5.0 percent).
Share of distressed sales continue annual decline
Total distressed sales — bank-owned (REO) sales, third-party foreclosure auction sales, and short sales — accounted for 14.2 percent of all single family and condo sales in Q1 2019, up from 12.9 percent in the previous quarter but down from 15.2 percent in Q1 2018.
Among 135 metropolitan statistical areas with a population of at least 200,000 and at least 100 total distressed sales in Q1 2019, those with the highest share of total distressed sales were Atlantic City, New Jersey (33.1 percent); Trenton, New Jersey (28.0 percent); Rockford, Illinois (27.3 percent); Peoria, Illinois (26.1 percent); and Shreveport, Louisiana (25.9 percent).
Counter to the national trend, 33 of the 135 metro areas (24 percent) posted year-over-year increases in share of distressed sales, including San Antonio, Texas (up 22.2 percent); Salt Lake City, Utah (up 20.6 percent); New Orleans, Louisiana (up 11.8 percent); Indianapolis, Indiana (up 10.6 percent); and Raleigh, North Carolina (up 8.9 percent).
FHA buyers share drops 7 percent from last year
Sales to FHA buyers (typically first-time homebuyers or other buyers with a low down payment) represented 10.9 percent of all U.S. single family and condo sales in Q1 2019, up from 10.8 percent of all sales in the previous quarter but down from 11.8 percent in Q1 2018 to the 8th consecutive quarter with annual decreases.
Among metro areas with a population of at least 1 million, those with the highest share of sales to FHA buyers were Indianapolis, Indiana (18.5 percent); Riverside, California (18.0 percent); Houston, Texas (17.3 percent); Providence, Rhode Island (16.2 percent); and Hartford, Connecticut (16.2 percent).
###
Report methodology
The ATTOM Data Solutions U.S. Home Sales Report provides percentages of distressed sales and all sales that are sold to investors, institutional investors and cash buyers, a state and metropolitan statistical area. Data is also available at the county and zip code level upon request. The data is derived from recorded sales deeds, foreclosure filings and loan data. Statistics for previous quarters are revised when each new report is issued as more deed data becomes available.
Definitions
All-cash purchase: sale where no loan is recorded at the time of sale and where ATTOM has coverage of loan data.
Homeownership tenure: for a given market and given quarter, the average time between the most recent sale date and the previous sale date, expressed in years.
Home seller price gains: the difference between the median sales price of homes in a given market in a given quarter and the median sales price of the previous sale of those same homes, expressed both in a dollar amount and as a percentage of the previous median sales price.
Institutional investor purchases: residential property sales to non-lending entities that purchased at least 10 properties in a calendar year.
REO sale: a sale of a property that occurs while the property is actively bank owned (REO).
Short sale: a sale of a property where the sale price is less than (short) the combined amount of loans secured by the property.
Third-party foreclosure auction sale: a sale of a property that occurs at the public foreclosure auction (trustee’s sale or sheriff’s sale) in which the property is sold to a third-party buyer and does not transfer back to the foreclosing bank.
About ATTOM Data Solutions
ATTOM Data Solutions provides premium property data to power products that improve transparency, innovation, efficiency and disruption in a data-driven economy. ATTOM multi-sources property tax, deed, mortgage, foreclosure, environmental risk, natural hazard, and neighborhood data for more than 155 million U.S. residential and commercial properties covering 99 percent of the nation’s population. A rigorous data management process involving more than 20 steps validates, standardizes and enhances the data collected by ATTOM, assigning each property record with a persistent, unique ID — the ATTOM ID. The 9TB ATTOM Data Warehouse fuels innovation in many industries including mortgage, real estate, insurance, marketing, government and more through flexible data delivery solutions that include bulk file licenses, APIs, market trends, marketing lists, match & append and introducing the first property data deliver solution, a cloud-based data platform that streamlines data management – Data-as-a-Service (DaaS).
Media Contact:
Christine Stricker
949.748.8428
christine.stricker@attomdata.com
Data and Report Licensing:
949.502.8313