Annual Home Price Appreciation (HPA) Increases in 89 Percent of Local Markets; U.S. Average Homeownership Tenure Sees an Annual Increase of 4 Percent; Profit Margins Rose to 33.9 Percent with Dollar Gains Reaching $67,500
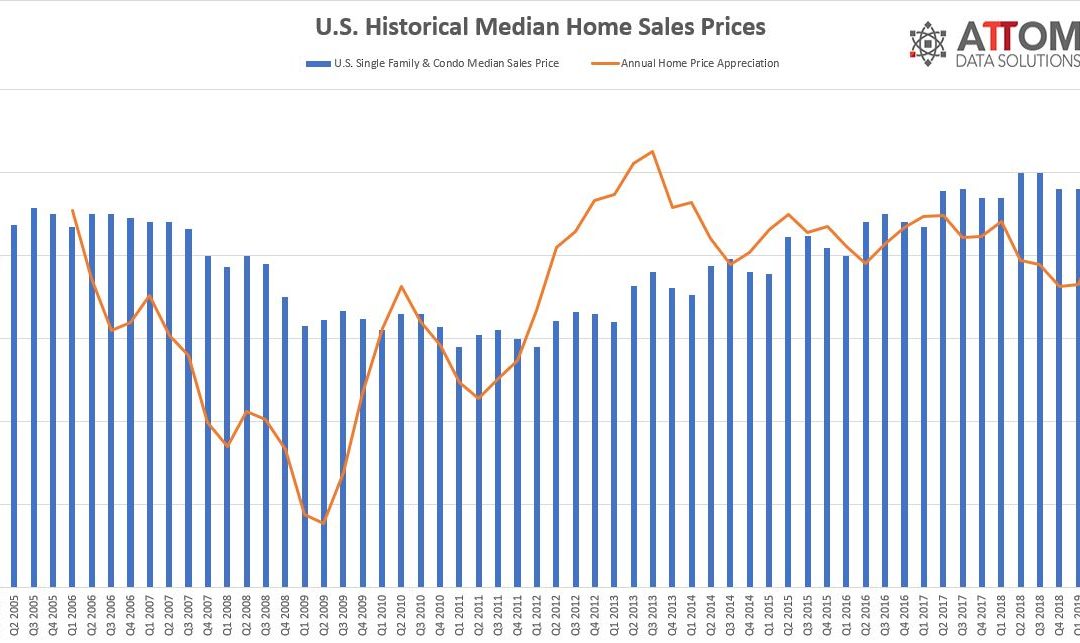
IRVINE, Calif. – July 18, 2019 — ATTOM Data Solutions, curator of the nation’s premier property database and first property data provider of Data-as-a-Service (DaaS), today released its Q2 2019 U.S. Home Sales Report, which shows that U.S. single family homes and condos sold for a median price of $266,000 in the second quarter, up 10.8 percent from the previous quarter and up 6.4 percent from a year ago — reaching a new median home price peak.
Meanwhile, the report also shows that homeowners who sold in the second quarter had owned an average of 8.09 years, reaching a new peak, up 3 percent from last quarter and up 4 percent from Q2 2018. Homeownership tenure averaged 4.21 years nationwide between Q1 2000 and Q3 2007, prior to the Great Recession. If you are interested in learning more about our home sales data sets, visit our home sales report page.
“As warmer weather brings a rush of house hunters to the market, the latest spike in median home prices marked the largest quarterly increase since the second quarter of 2015 and the third biggest increase since the market started climbing out of the Great Recession in 2012,” said Todd Teta, chief product officer at ATTOM Data Solutions. “However, in looking at historical trends, the second quarter of every year has always shown a quarterly increase, going as far back as 2005. So, with mortgage rates dipping to new lows, it’s no surprise that people were wanting to buy a home, even if prices were at their peak. We expect to see milder home prices in the coming quarters.”
Annual home price appreciations rising in Milwaukee, Boston and Salt Lake City
Median home prices in 133 of the 149 metro areas analyzed in the report (89 percent) saw an annual home price appreciation in the second quarter of 2019, led by Atlantic City, New Jersey (16.0 percent increase); Boise City, Idaho (14.0 percent increase); Chattanooga, Tennessee (13.9 percent increase); Mobile, Alabama (11.2 percent increase); and Madison, Wisconsin (10.8 percent increase).
Those major metros with at least 1 million people that saw annual home price appreciations occurring in the second quarter of 2019 included: Milwaukee, Wisconsin (9.0 percent increase); Boston, Massachusetts (9.0 percent increase); Salt Lake City, Utah (8.7 percent increase); Columbus, Ohio (8.1 percent increase); and Birmingham, Alabama (6.3 percent increase).
Prices in Denver, Austin, Dallas and Nashville 50+ percent above pre-recession peaks
Median home prices in 110 of the 149 metro areas analyzed in the report (74 percent) were above pre-recession peaks in the second quarter of 2019, led by Greeley, Colorado (87 percent above); Shreveport, Louisiana (81 percent above); Denver, Colorado (80 percent above); Austin, Texas (77 percent above); and Fort Collins, Colorado (76 percent above).
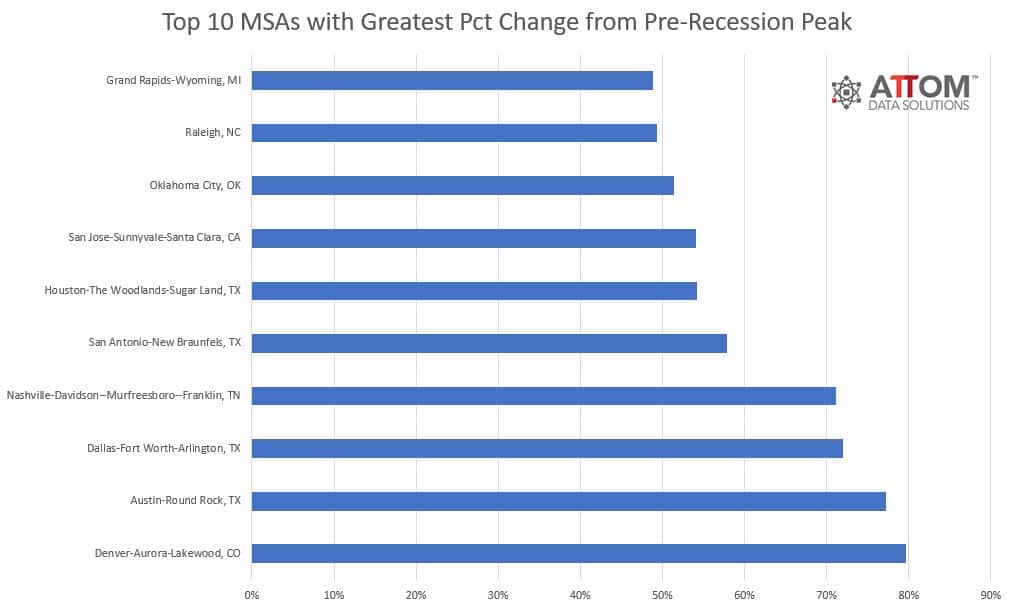
Including Denver and Austin, other major metros with at least 1 million people and with Q2 2019 median home prices at least 40 percent above pre-recession peaks were Dallas-Fort Worth, Texas (72 percent above); Nashville, Tennessee (71 percent above); San Antonio, Texas (58 percent above); Houston, Texas (54 percent above); and San Jose, California (54 percent above).
Average home seller gains increase quarterly and annually
U.S. homeowners who sold in the second quarter of 2019 realized an average home price gain since purchase of $67,500, up from an average gain of $57,706 in Q1 2019 and up from an average gain of $60,100 in Q2 2018. The average home seller gain of $67,500 in Q2 2019 represented an average 33.9 percent return as a percentage of original purchase price.
Among 149 metropolitan statistical areas analyzed in the report, those with the highest average home seller returns in Q2 2019 were San Jose, California (85.0 percent); San Francisco, California (71.6 percent); Seattle, Washington (65.6 percent); Salem, Oregon (62.3 percent); and Salt Lake City, Utah (60.7 percent).
Average homeownership tenure drops annually in Tucson, Portland and Phoenix
Counter to the national trend which saw the longest homeownership tenure to date, the average homeownership tenure in Q2 2019 decreased from a year ago in 28 of 108 metro areas analyzed in the report (26 percent), led by Merced, Colorado Springs, Vallejo, Springfield and Bremerton.
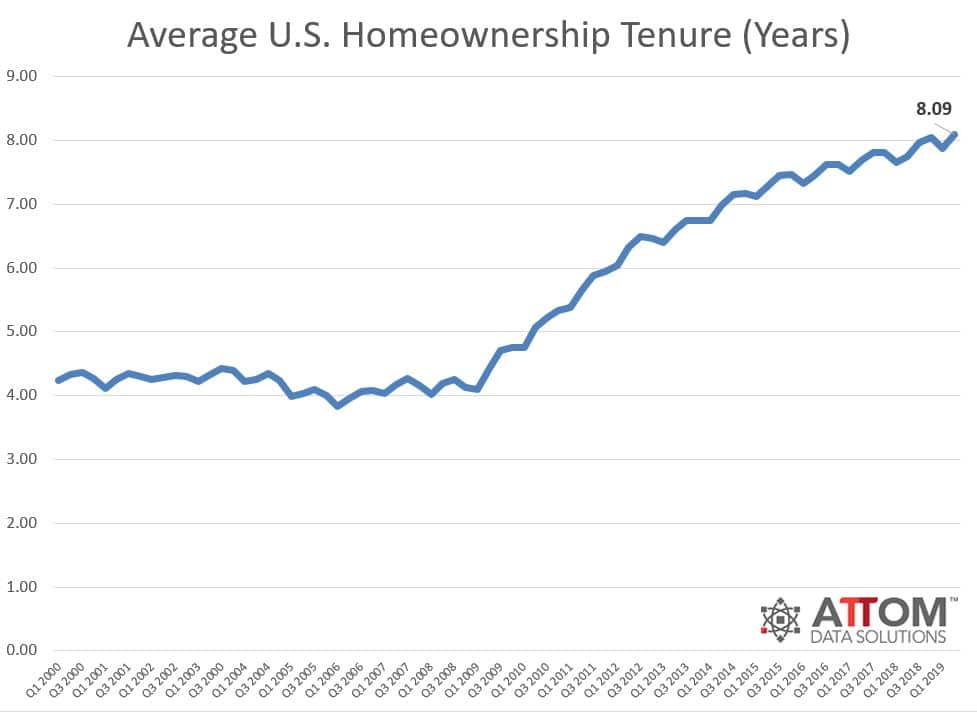
Among major metropolitan areas that have a population of at least 1 million and where tenure decreased in the second quarter of 2019. The longest average times sellers lived in their homes were in Tucson, Arizona (8.88 years); Portland, Oregon (9.04 years); Phoenix, Arizona (8.17 years); San Francisco, California (10.26 years); and Tampa-St. Petersburg, Florida (7.85 years).
Share of cash sales decrease annually
All-cash sales represented 25.0 percent of all single family and condo sales in Q2 2019, down from 27.7 percent of all sales in the previous quarter, and down from 26.9 percent of all sales in Q2 2018.
Among major metropolitan areas with a population of at least 1 million, those with the highest share of all-cash sales in Q2 2019 were; Miami, Florida (40.5 percent); Detroit, Michigan (36.7 percent); Birmingham, Alabama (34.9 percent); Tampa-St. Petersburg, Florida (34.2 percent); and Jacksonville, Florida (33.9 percent).
Institutional investor sales highest in Atlanta, Charlotte, and Memphis
The share of U.S. single family home and condo sales sold to institutional investors (entities buying at least 10 properties in a calendar year) was 2.2 percent in the second quarter of 2019, up from 1.9 percent in the previous quarter but down from 2.4 percent a year ago.
Among the metropolitan statistical areas with a population of at least 1,000,000 and at least 50 institutional investor sales in Q2 2019, those with the highest share of institutional investor sales in the second quarter were; Atlanta, Georgia (7.9 percent); Charlotte, North Carolina (6.7 percent); Memphis, Tennessee (6.4 percent); Birmingham, Alabama (5.6 percent); and Raleigh, North Carolina (5.5 percent).
Share of FHA buyers increase annually
Sales to FHA buyers (typically first-time homebuyers or other buyers with a low-down payment) represented 11.6 percent of all U.S. single family and condo sales in Q2 2019, up from 11.1 percent of all sales in the previous quarter and up from 9.9 percent in Q2 2018.
Among metro areas with a population of at least 1 million, those with the highest share of sales to FHA buyers were Riverside, California (18.6 percent); Indianapolis, Indiana (18.4 percent); San Antonio, Texas (18.2 percent); Providence, Rhode Island (17.8 percent); and Kansas City, Missouri (17.6 percent).
Share of distressed sales continuing downward trend
Total distressed sales — bank-owned (REO) sales, third-party foreclosure auction sales, and short sales — accounted for 11.4 percent of all single family and condo sales in Q2 2019, down from 14.0 percent in the previous quarter and up less than one percent from the same time last year.
Among 149 metropolitan statistical areas with a population of at least 200,000 and at least 100 total distressed sales in Q2 2019, those with the highest share of total distressed sales were Atlantic City, New Jersey (27.6 percent); Trenton, New Jersey (25.3 percent); Norwich-New London, Connecticut (22.2 percent); Erie, Pennsylvania (22.1 percent); and Macon, Georgia (20.7 percent).
Counter to the national trend of a slight annual uptick, 110 of the 150 metro areas (73 percent) posted year-over-year decreases in share of distressed sales. Those major metros with a population greater than 1 million that saw an annual decline were Dallas-Fort Worth, Texas (down 25.7 percent); Boston, Massachusetts (down 24 percent); Portland, Oregon (down 23.6 percent); Buffalo, New York (down 22.1 percent); and Tucson, Arizona (down 21.2 percent).
###
Report methodology
The ATTOM Data Solutions U.S. Home Sales Report provides percentages of distressed sales and all sales that are sold to investors, institutional investors and cash buyers, a state and metropolitan statistical area. Data is also available at the county and zip code level upon request. The data is derived from recorded sales deeds, foreclosure filings and loan data. Statistics for previous quarters are revised when each new report is issued as more deed data becomes available.
Definitions
All-cash purchase: sale where no loan is recorded at the time of sale and where ATTOM has coverage of loan data.
Homeownership tenure: for a given market and given quarter, the average time between the most recent sale date and the previous sale date, expressed in years.
Home seller price gains: the difference between the median sales price of homes in a given market in a given quarter and the median sales price of the previous sale of those same homes, expressed both in a dollar amount and as a percentage of the previous median sales price.
Institutional investor purchases: residential property sales to non-lending entities that purchased at least 10 properties in a calendar year.
REO sale: a sale of a property that occurs while the property is actively bank owned (REO).
Short sale: a sale of a property where the sale price is less than (short) the combined amount of loans secured by the property.
Third-party foreclosure auction sale: a sale of a property that occurs at the public foreclosure auction (trustee’s sale or sheriff’s sale) in which the property is sold to a third-party buyer and does not transfer back to the foreclosing bank.
About ATTOM Data Solutions
ATTOM Data Solutions provides premium property data to power products that improve transparency, innovation, efficiency and disruption in a data-driven economy. ATTOM multi-sources property tax, deed, mortgage, foreclosure, environmental risk, natural hazard, and neighborhood data for more than 155 million U.S. residential and commercial properties covering 99 percent of the nation’s population. A rigorous data management process involving more than 20 steps validates, standardizes and enhances the data collected by ATTOM, assigning each property record with a persistent, unique ID — the ATTOM ID. The 9TB ATTOM Data Warehouse fuels innovation in many industries including mortgage, real estate, insurance, marketing, government and more through flexible data delivery solutions that include bulk property data licensing, Property Data APIs, market trends, marketing lists, match & append and introducing the first property data deliver solution, a cloud-based data platform that streamlines data management – Data-as-a-Service (DaaS).
Media Contact:
Christine Stricker
949.748.8428
christine.stricker@attomdata.com
Data and Report Licensing:
949.502.8313
