According to ATTOM’s just released Q2 2024 U.S. Home Affordability Report, median-priced single-family homes and condos remained less affordable in the second quarter of 2024 compared to historical averages in 99 percent of counties with sufficient data. This trend, which began in early 2022, indicates that homeownership continues to require historically large portions of wages nationwide due to persistently high residential mortgage rates and elevated home prices.
ATTOM’s latest home affordability analysis also indicates that major expenses on median-priced homes consumed 35.1 percent of the average national wage in the second quarter, the highest level since 2007. This figure significantly exceeds the typical 28 percent lending guideline.
The latest report notes that both the historical and current measures represent quarterly and annual setbacks after a brief period of improvement from late 2023 to early 2024. This shift occurred as the national median home price increased to a new high of $360,000 during the Spring buying season, while mortgage rates remained around 7 percent. These factors led to increases in the cost of homeownership that outpaced recent wage growth.
ATTOM’s Q2 2024 home affordability report also indicates that as a result, the portion of average wages nationwide required for typical mortgage payments, property taxes, and insurance grew by approximately three percentage points compared to both the first quarter of this year and the second quarter of last year.
The latest report also found that as home prices soared and interest rates remained relatively high, the portion of average local wages consumed by major expenses on median-priced single-family homes and condos increased from the first quarter to the second quarter of 2024 in 547, or 92.9 percent, of the 589 counties analyzed. This figure also surpassed the level from a year earlier in 92.4 percent of those markets.
Also, according to ATTOM’s new analysis the typical $2,114 cost of mortgage payments, homeowner insurance, mortgage insurance, and property taxes nationwide reached a new high, consuming 35.1 percent of the average annual national wage of $72,358 last quarter. This is up from 31.9 percent in the first quarter of 2024 and 32.1 percent in the second quarter of last year, significantly higher than the recent low of 21.3 percent in the first quarter of 2021.
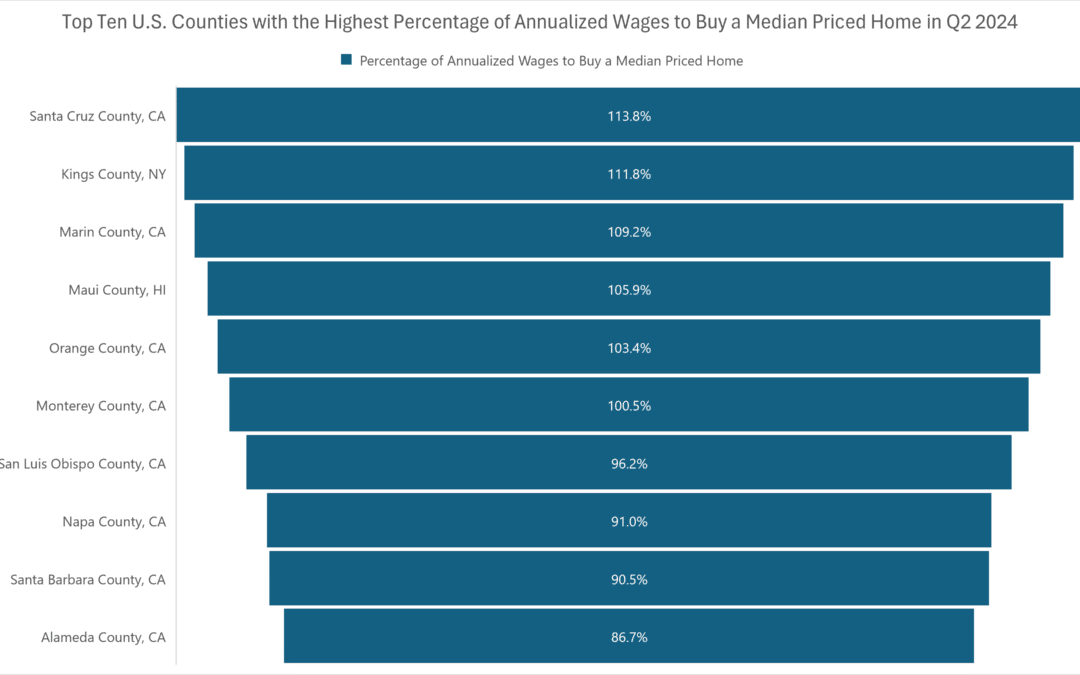
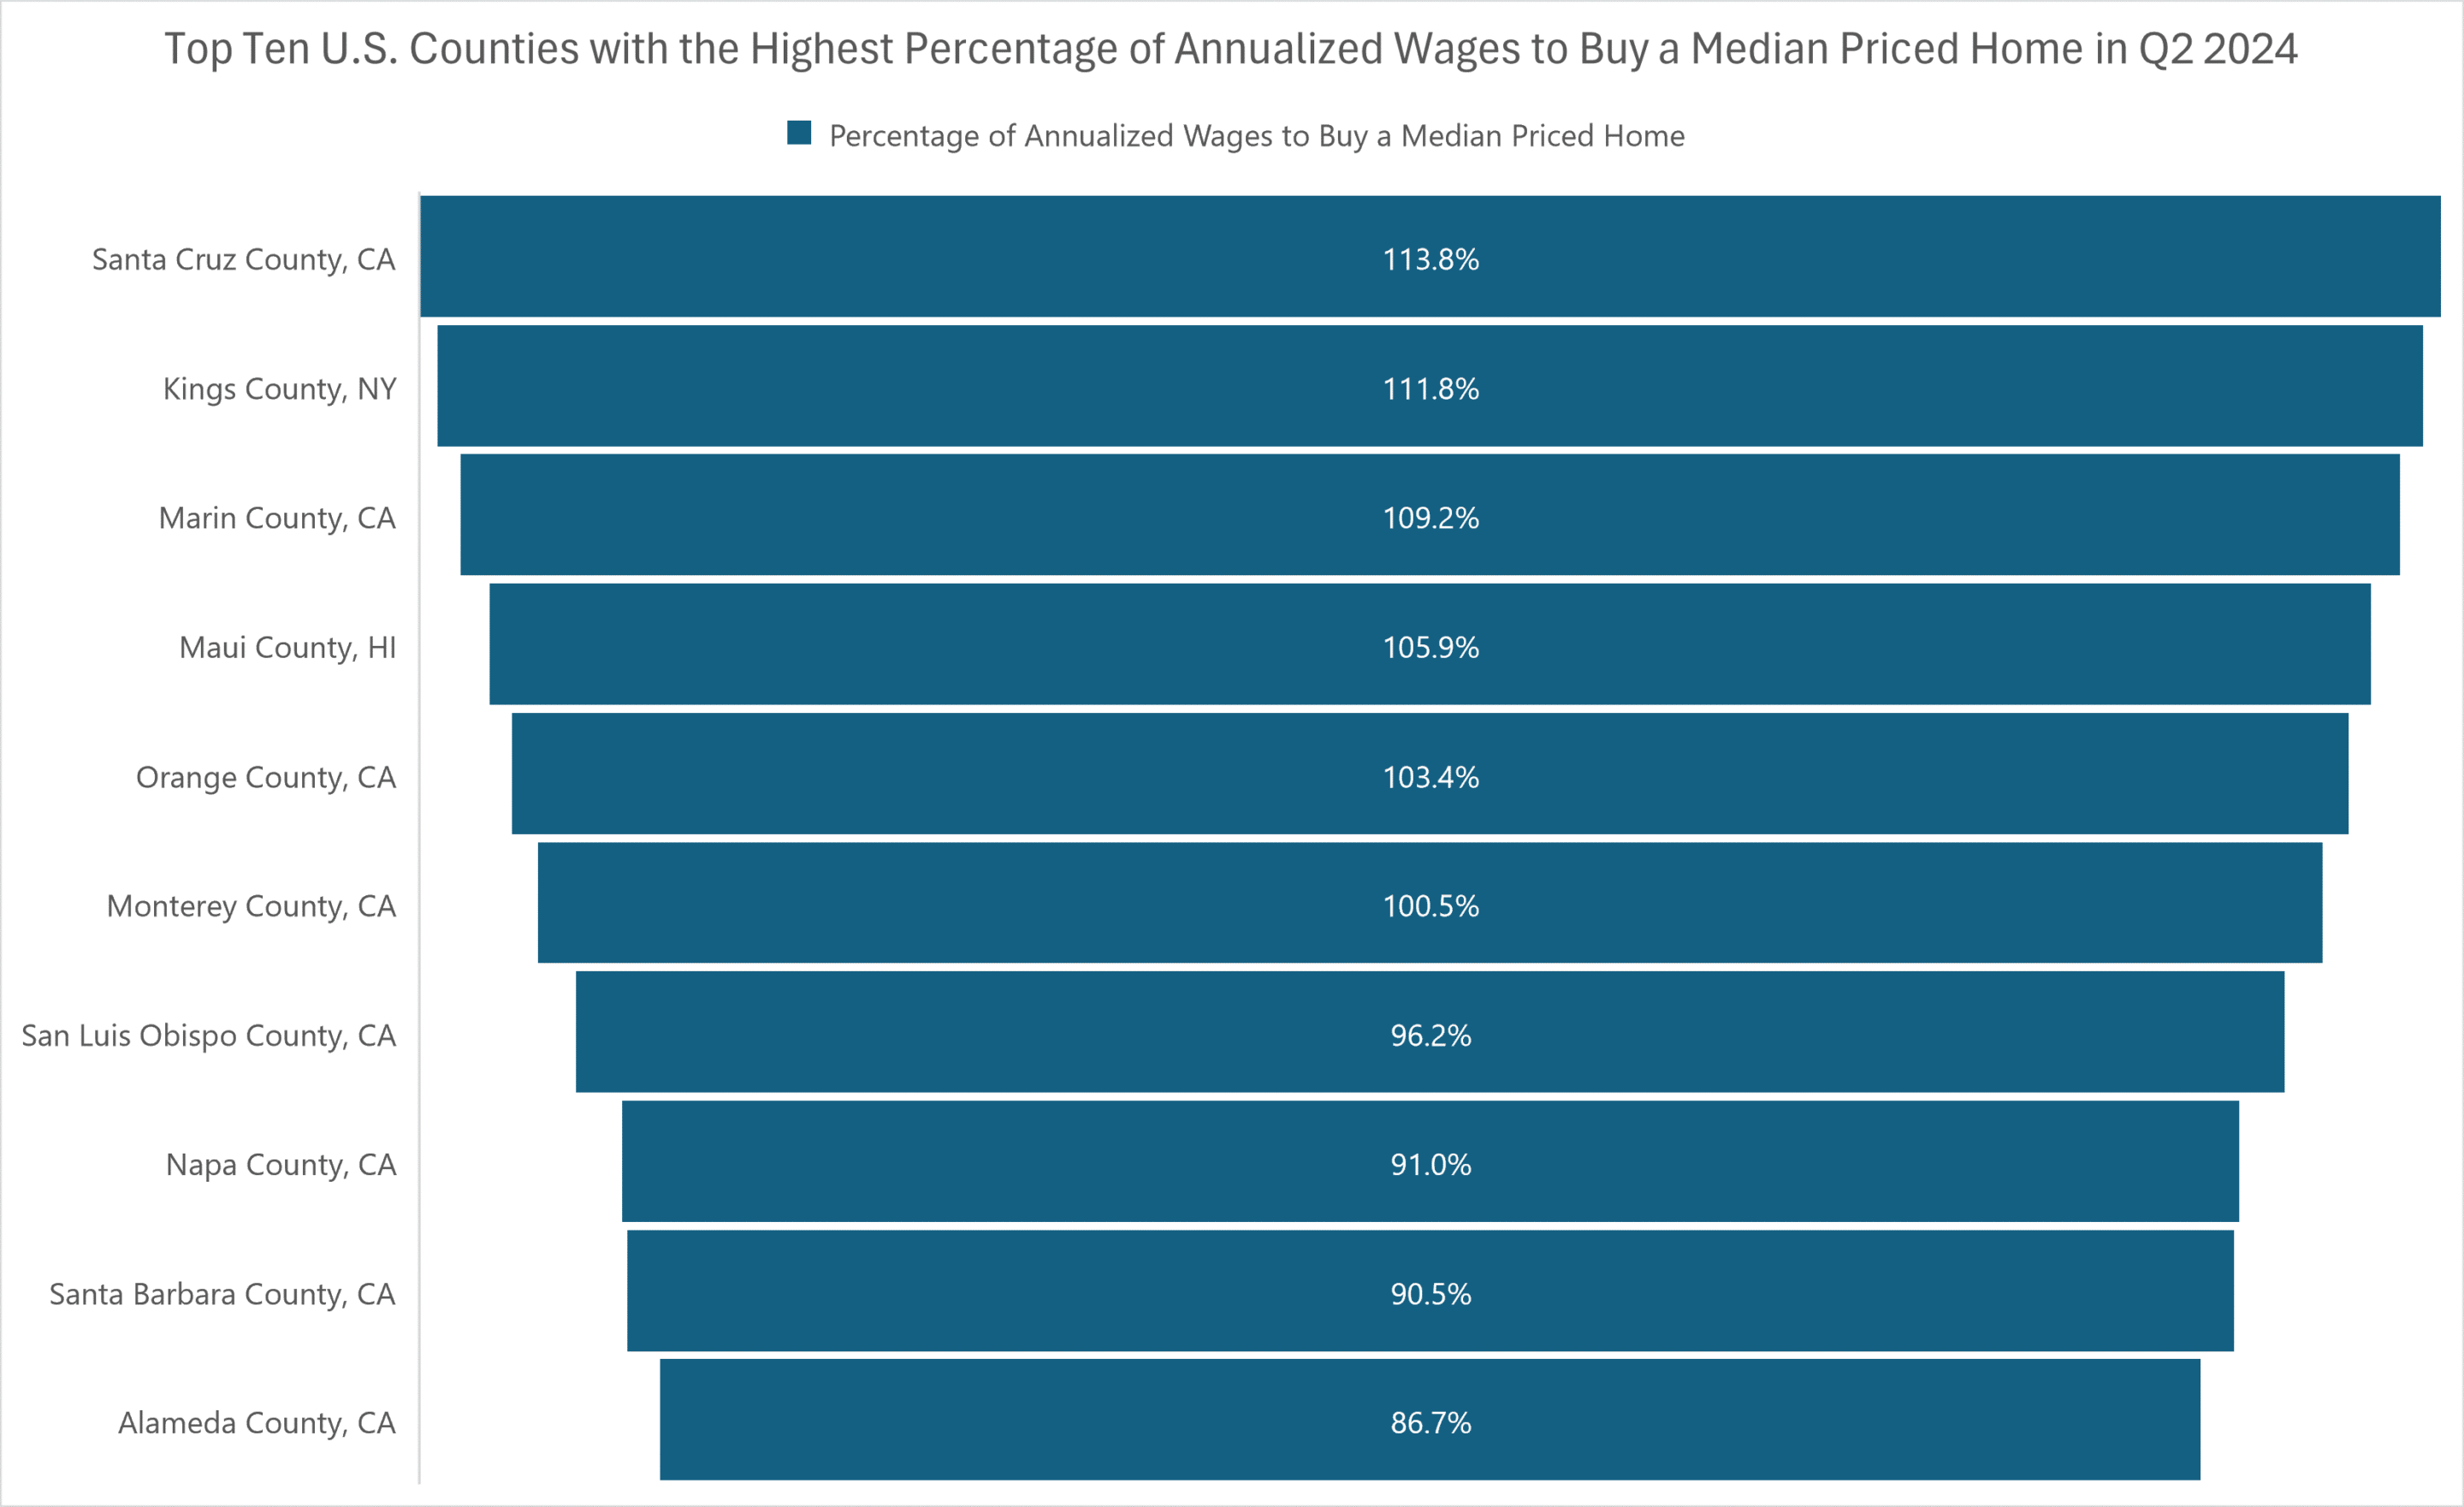
In this post, we dive deep into the data to uncover the list of those top 10 U.S. counties with a population of 100,000 or more and 50 or more sales in Q2 2024 that have the highest percentage of annualized wages required (for typical mortgage payments, property taxes and insurance) to buy a median-priced home with a 30-year fixed-rate mortgage and a 20 percent down payment in Q2 2024. Rounding out that list are: Santa Cruz County, CA (113.8 percent of annualized wages to purchase a median-priced home); Kings County, NY (111.8 percent); Marin County, CA (109.2 percent); Maui County, HI (105.9 percent); and Orange County, CA (103.4 percent), Monterey County, CA (100.5 percent), San Luis Obispo County, CA (96.2 percent), Napa County, CA (91 percent), Santa Barbara County, CA (90.5 percent), and Alameda County, CA (86.7 percent).
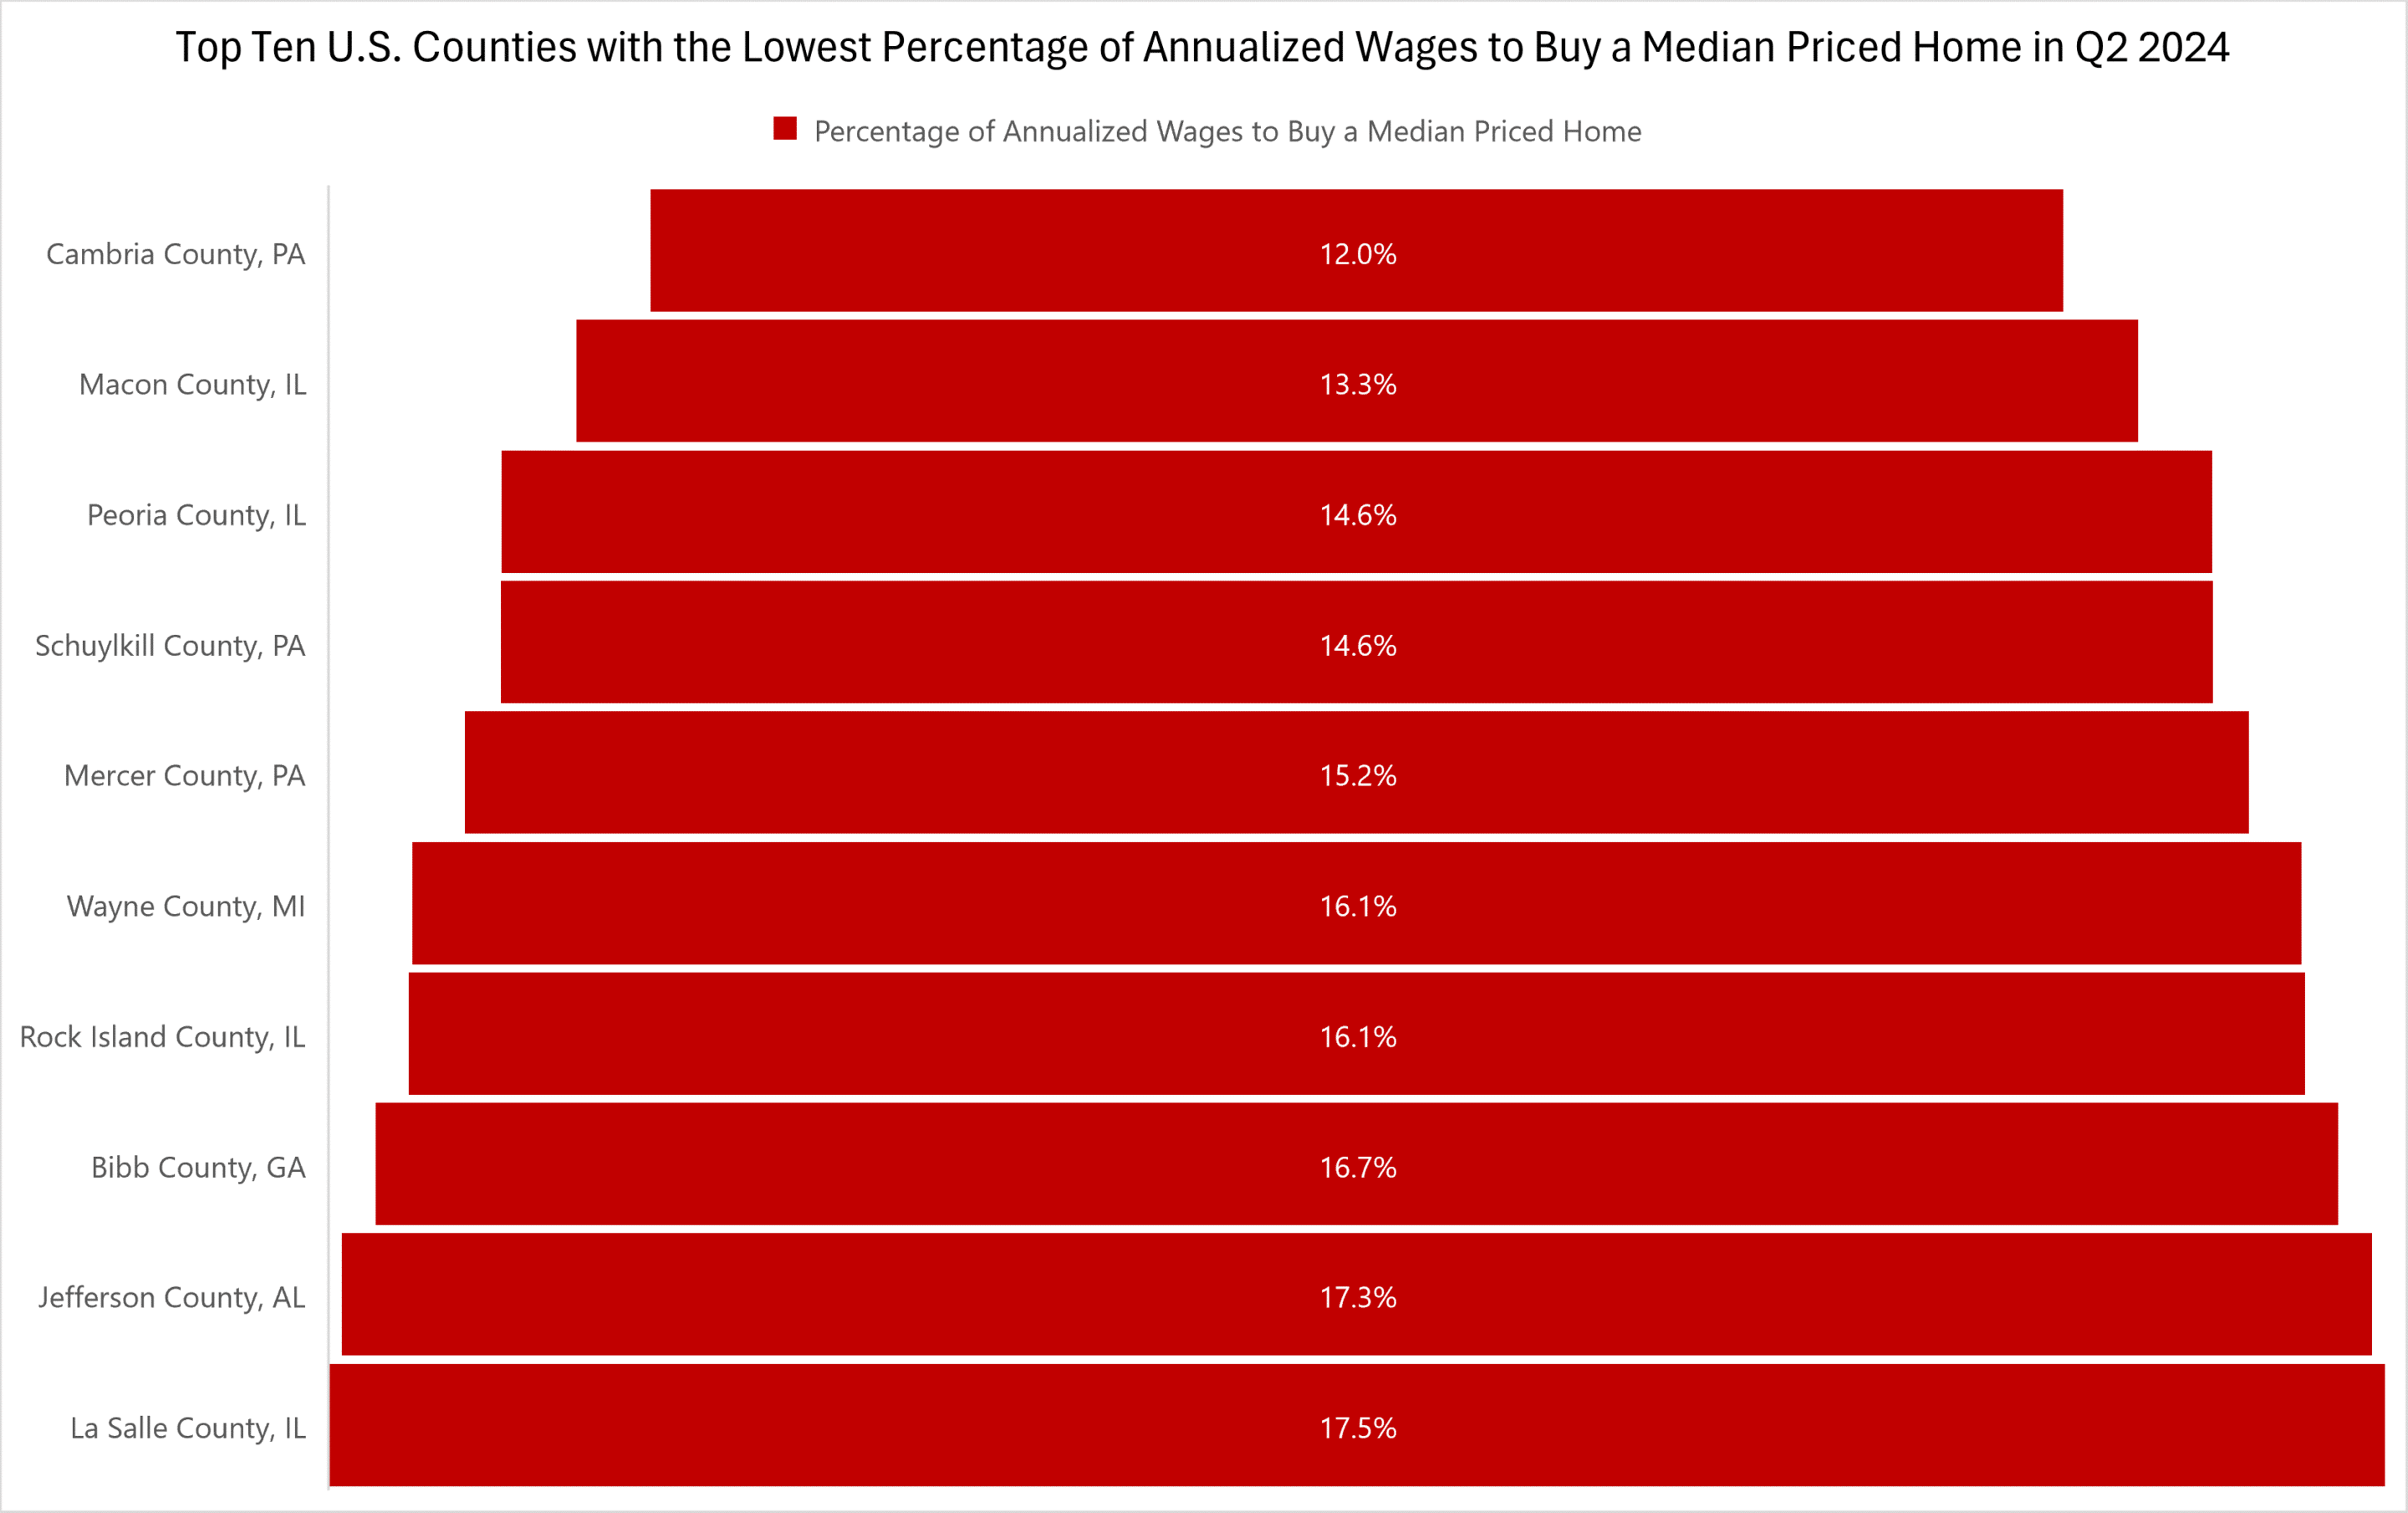
Also in this post, we dive deep into the data to uncover the list of those top 10 U.S. counties with a population of 100,000 or more and 50 or more sales in Q2 2024 that have the lowest percentage of annualized wages required (for typical mortgage payments, property taxes and insurance) to buy a median-priced home with a 30-year fixed-rate mortgage and a 20 percent down payment in Q2 2024. Rounding out that list are: Cambria County, PA (12 percent), Macon County, IL (13.3 percent), Peoria County, IL (14.6 percent), Schuylkill County, PA (14.6 percent), Mercer County, PA (15.2 percent), Wayne County, MI (16.1 percent), Rock Island County, IL (16.1 percent), Bibb County, GA (16,7 percent), Jefferson County, AL (17.3 percent), and La Salle County, IL (17.5 percent).
Want to learn more about home affordability in your area? Contact us to find out how!