
Foreclosure Starts Down 10 Percent from Last Year; Bank Repossessions Down 12 Percent from Last Year
IRVINE, Calif. — October 10, 2024 — ATTOM, a leading curator of land, property data, and real estate analytics, today released its Q3 2024 U.S. Foreclosure Market Report, which shows a total of 87,108 U.S. properties with foreclosure filings during the third quarter of 2024, down 2 percent from the previous quarter and down 13 percent from a year ago.
The report also shows a total of 29,668 U.S. properties with foreclosure filings in September 2024, down 2 percent from the previous month and down 19 percent from a year ago.
“While we are seeing a decrease in foreclosure starts and repossessions, it’s crucial to remain vigilant, as any economic disruptions or changes in interest rates could shift the current trend,” said Rob Barber, CEO of ATTOM. “Moving forward, we anticipate foreclosure levels will stay relatively low, but there could be localized increases in areas struggling with affordability or other market pressures.”
Foreclosure starts decrease nationwide
A total of 62,380 U.S. properties started the foreclosure process in Q3 2024, down less than 1 percent from the previous quarter and down 10 percent from a year ago.
States that had 1,000 or more foreclosures starts in Q3 2024 and saw the greatest annual decrease included, North Carolina (down 44 percent); Georgia (down 29 percent); Maryland (down 22 percent); New Jersey (down 20 percent); and South Carolina (down 19 percent).
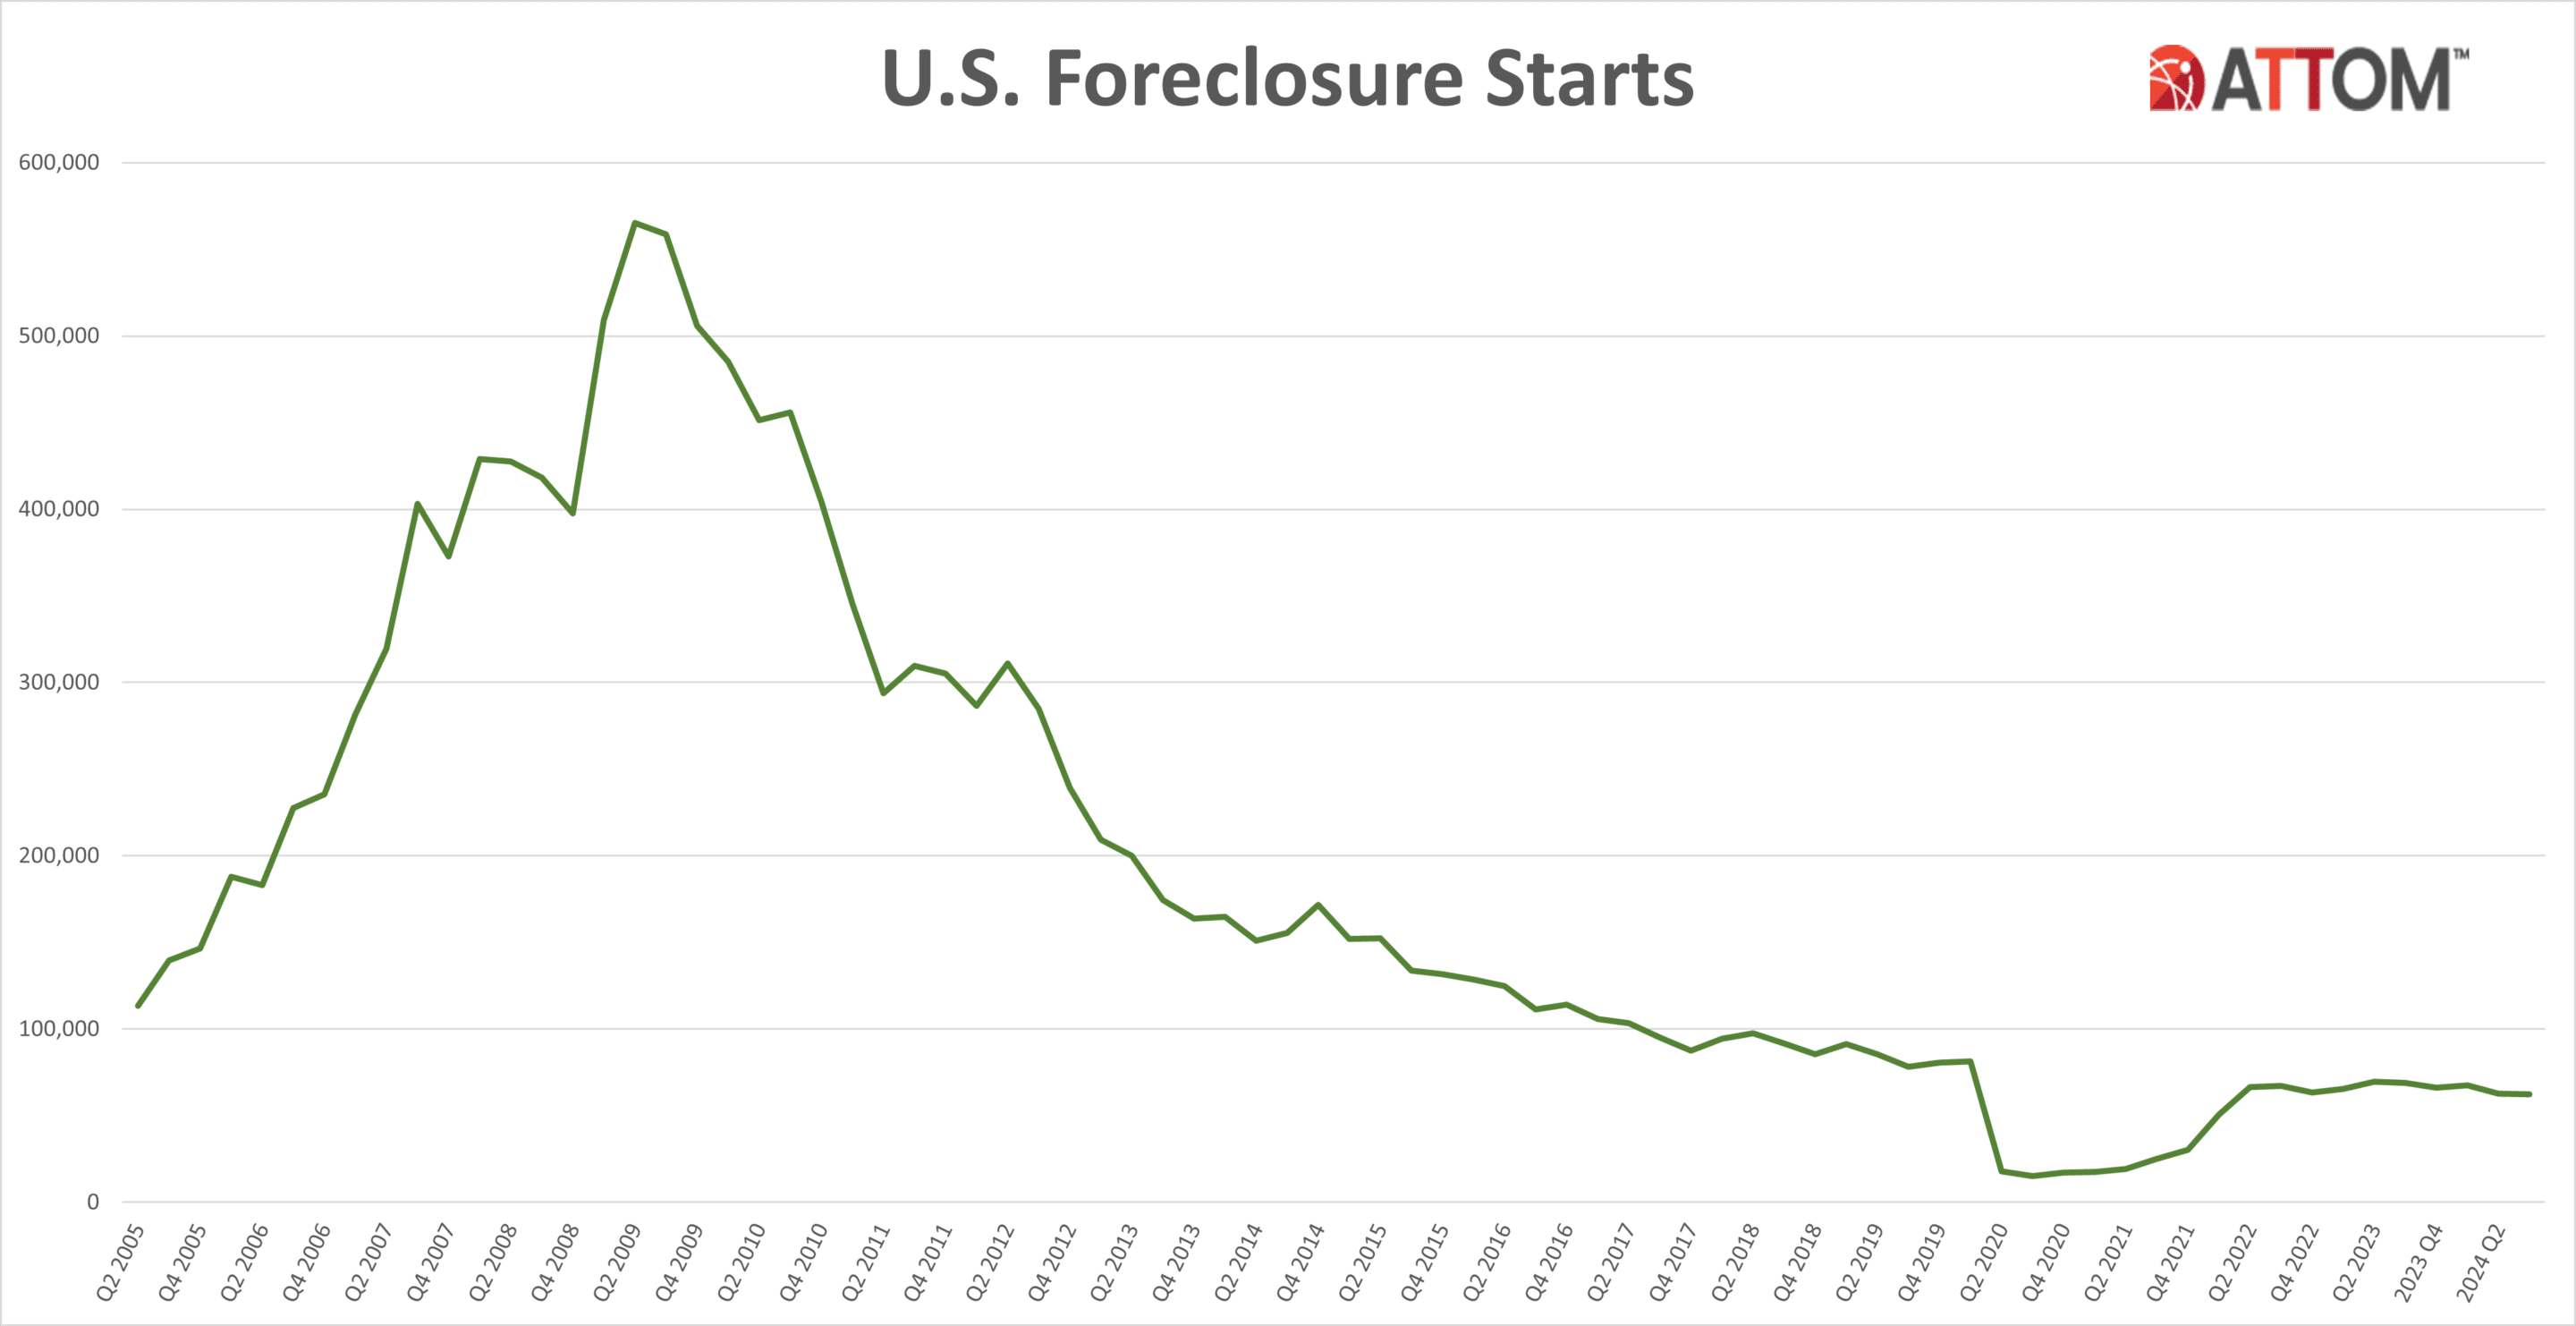
Those major metros with a population of 200,000 or more that had the greatest number of foreclosures starts in Q3 2024 included, New York, New York (3,776 foreclosure starts); Chicago, Illinois (3,231 foreclosure starts); Los Angeles, CA (2,166 foreclosure starts); Miami, FL (2,142 foreclosure starts); and Houston, Texas (1,791 foreclosure starts).
Highest foreclosure rates in Illinois, Nevada, and Florida
Nationwide one in every 1,618 housing units had a foreclosure filing in Q3 2024. States with the highest foreclosure rates were Illinois (one in every 904 housing units with a foreclosure filing); Nevada (one in every 922 housing units); Florida (one in every 971 housing units); Delaware (one in every 1,060 housing units); and South Carolina (one in every 1,069 housing units).
Among 224 metropolitan statistical areas with a population of at least 200,000, those with the highest foreclosure rates in Q3 2024 were Lakeland, Florida (one in 610 housing units); Provo, Utah (one in every 647 housing units); Macon, Georgia (one in every 649 housing units); Columbia, South Carolina (one in every 663 housing units); and Atlantic City, New Jersey (one in every 766 housing units).

Other major metros with a population of at least 1 million and foreclosure rates in the top 15 highest nationwide, include Chicago, Illinois (one in every 775 housing units); Las Vegas, Nevada (one in every 796 housing units); Cleveland, Ohio (one in every 819 housing units); Orlando, Florida (one in every 859 housing units); and Riverside, California (one in every 867 housing units).
Bank repossessions decrease 12 percent from last year
Lenders repossessed 8,795 U.S. properties through foreclosure (REO) in Q3 2024, up 1 percent from the previous quarter but down 12 percent from a year ago.
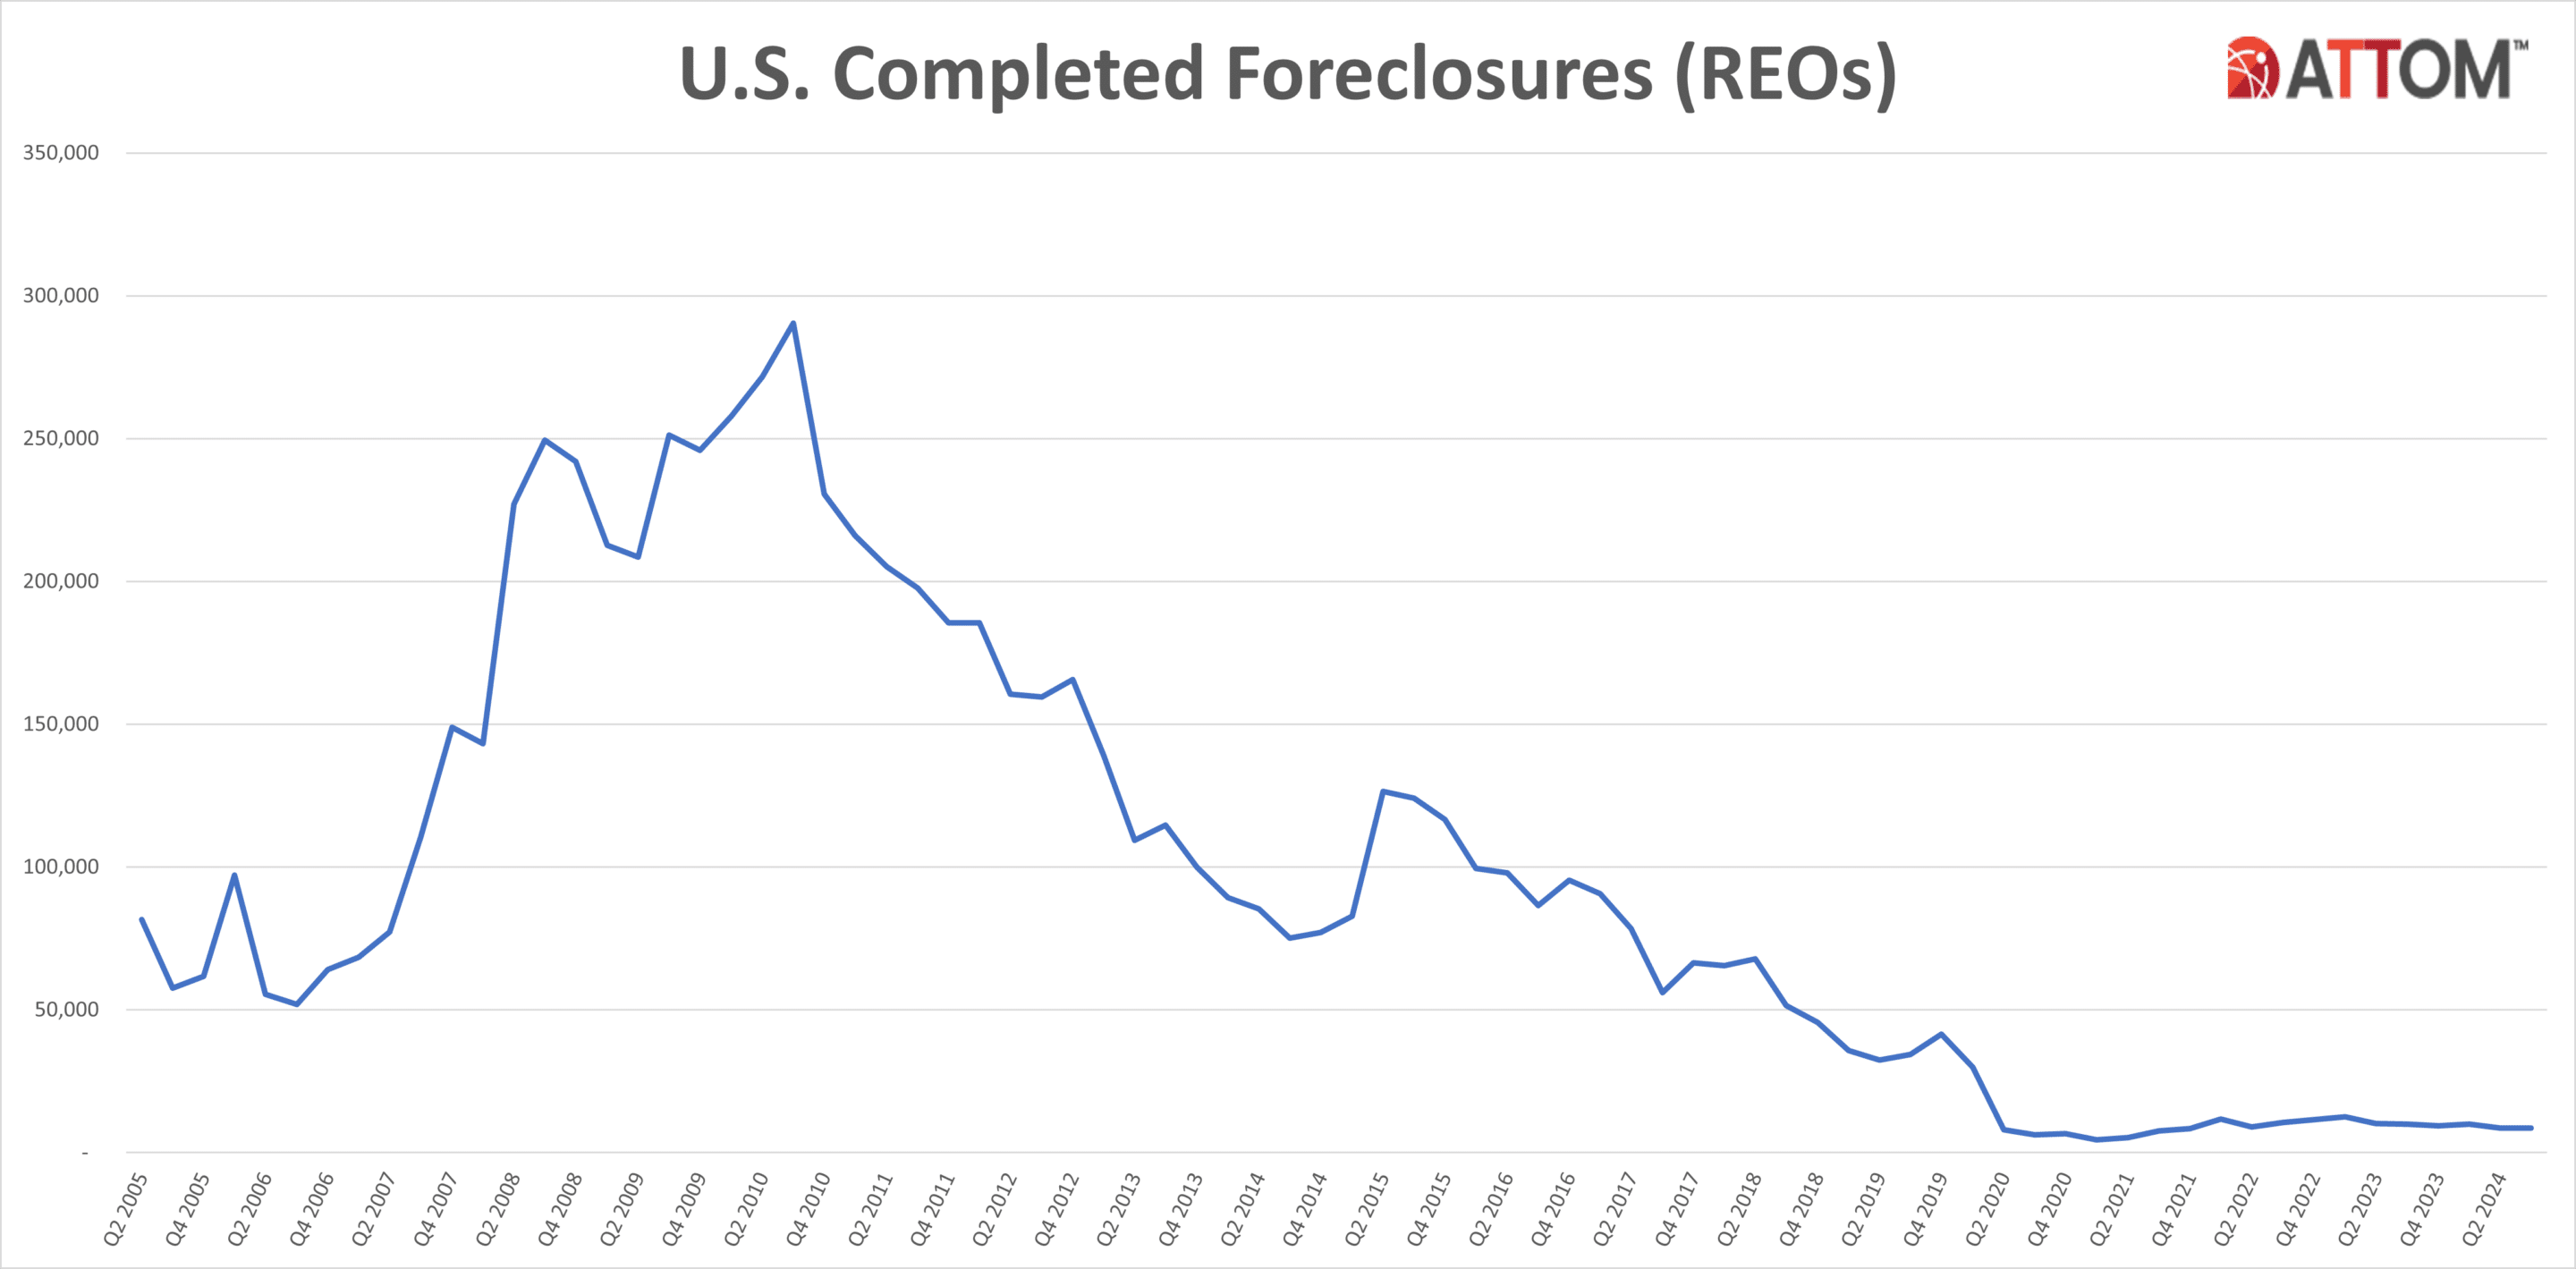
Those states that had the greatest number of REOs in Q3 2024 were California (852 REOs); Pennsylvania (715 REOs); New York (670 REOs); Illinois (668 REOs); and Michigan (559 REOs).

Average time to foreclose increases 6 percent from last year
Properties foreclosed in Q3 2024 had been in the foreclosure process for an average of 815 days. This remains the same from the previous quarter but represents a 6 percent increase from the same time last year, continuing an upward trajectory since Q3 2023.
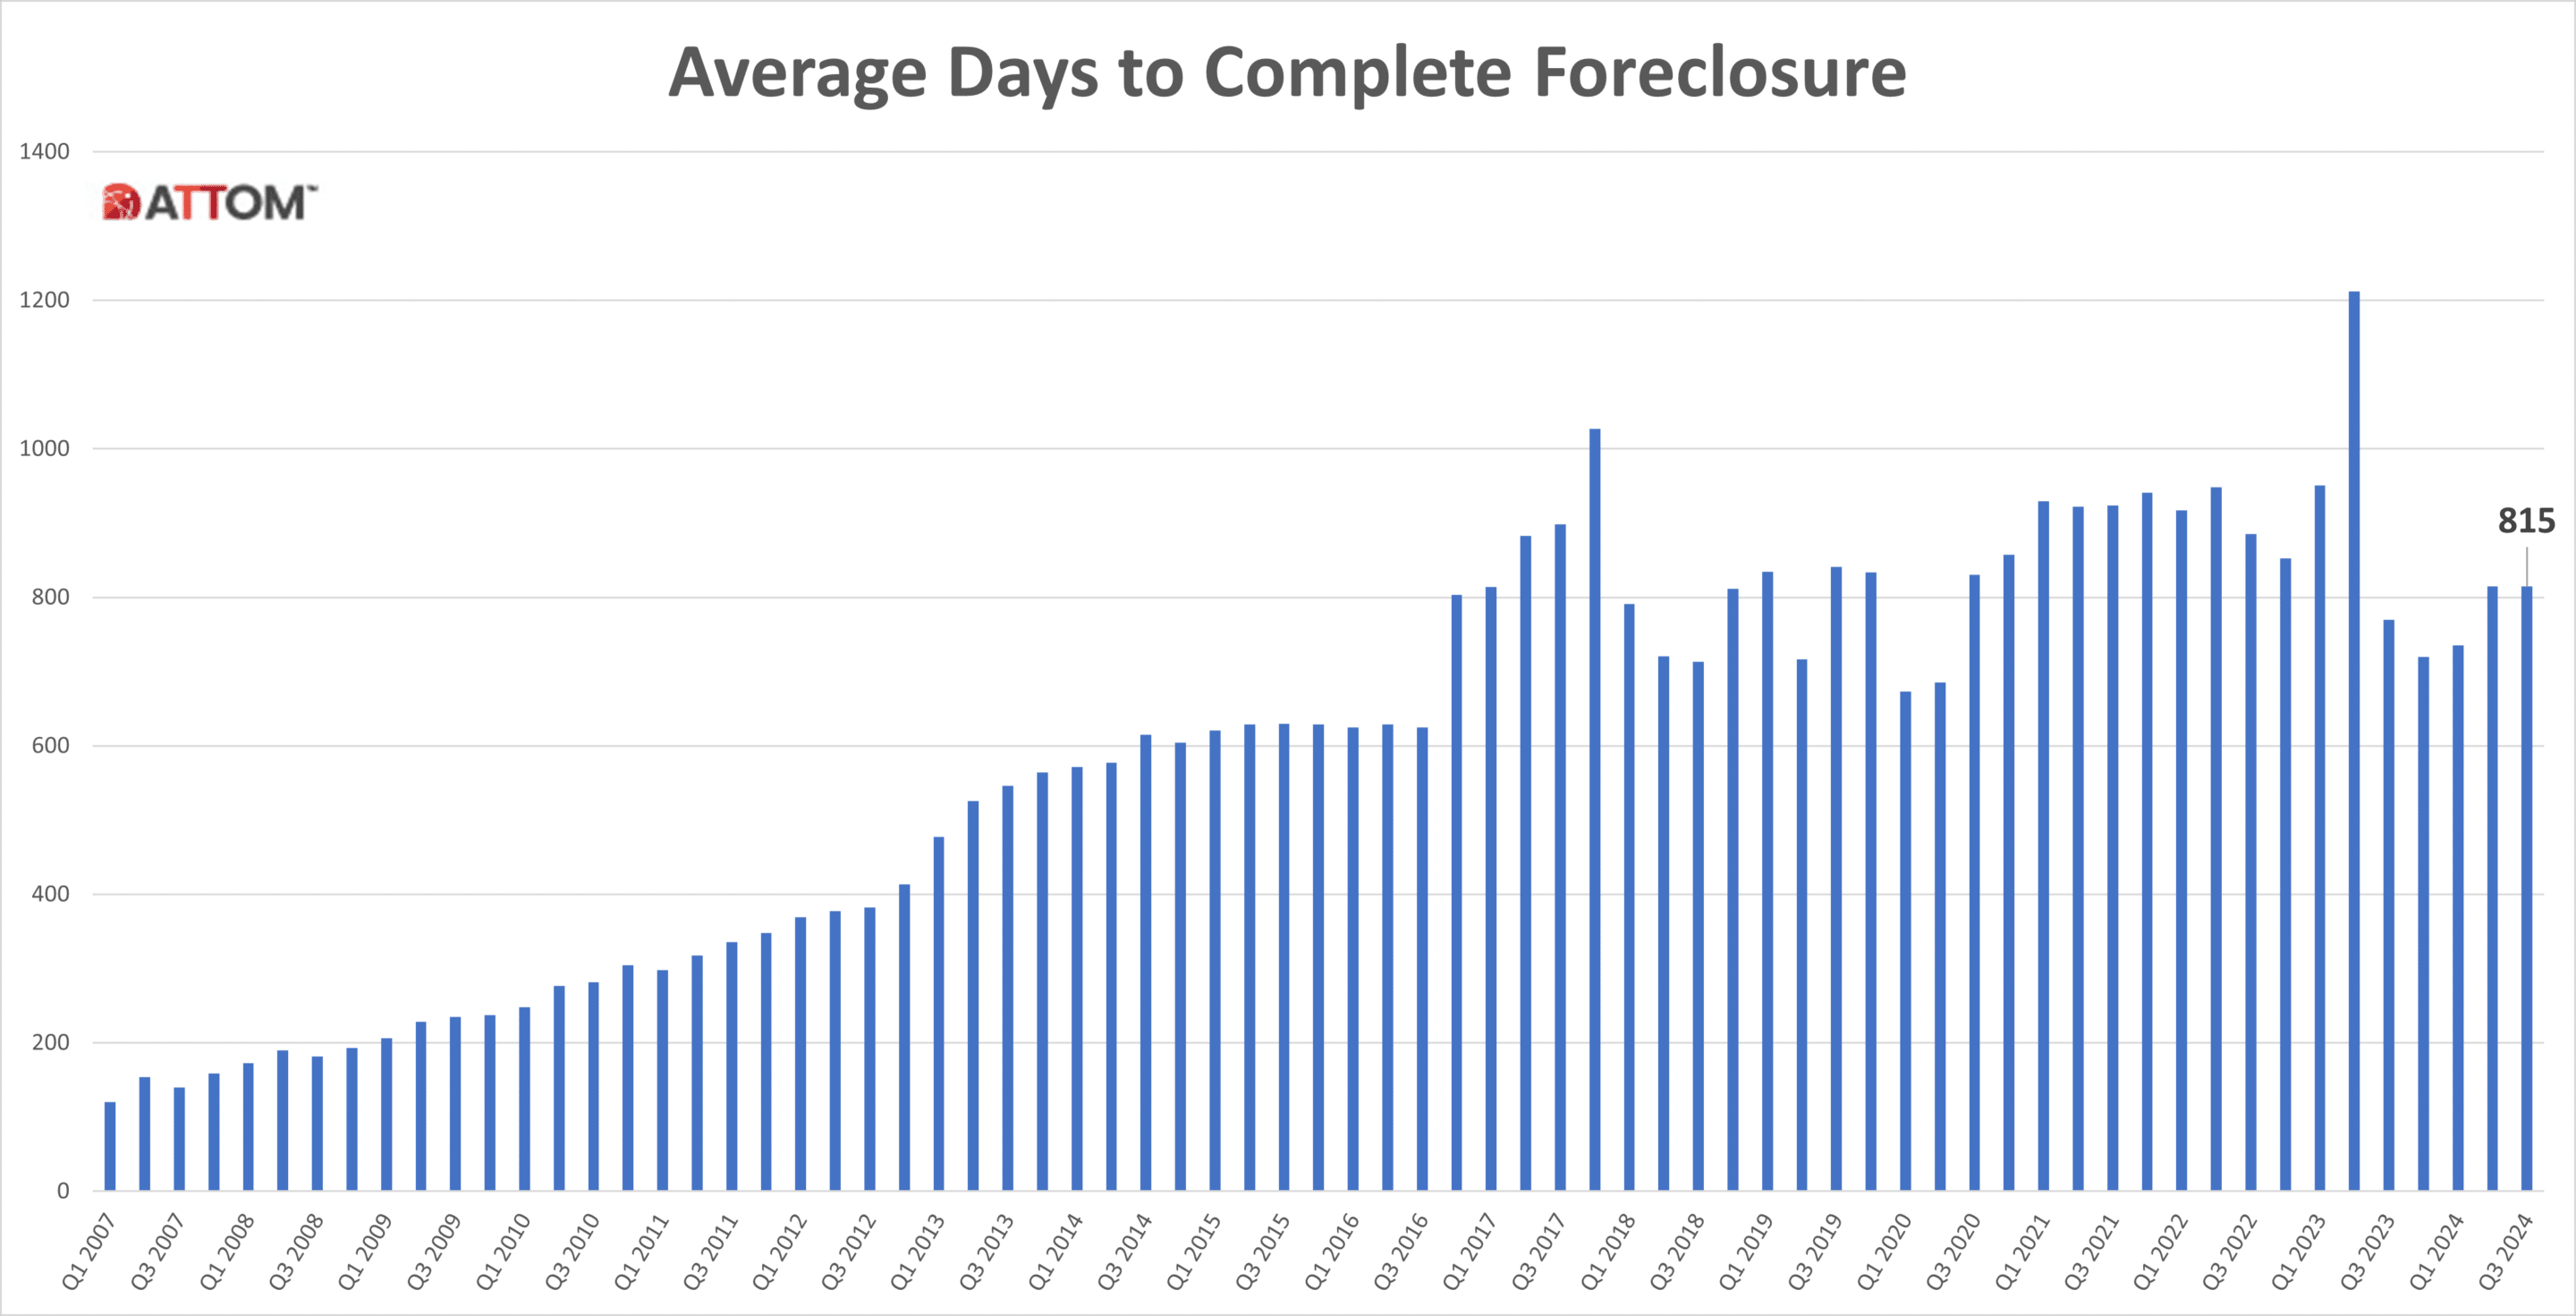
States with the longest average foreclosure timelines for homes foreclosed in Q3 2024 were Louisiana (3,520 days); Hawaii (2,531 days); New York (2,087 days); Rhode Island (1,880 days); and Georgia (1,876 days).
States with the shortest average foreclosure timelines for homes foreclosed in Q3 2024 were New Hampshire (165 days); Minnesota (172 days); Texas (181 days); Michigan (189 days); and Montana (248 days).
September 2024 Foreclosure Activity High-Level Takeaways
- Nationwide in September 2024, one in every 4,750 properties had a foreclosure filing.
- States with the highest foreclosure rates in September 2024 were Illinois (one in every 2,494 housing units with a foreclosure filing); Florida (one in every 2,670 housing units); Delaware (one in every 2,720 housing units); Nevada (one in every 2,735 housing units); and Indiana (one in every 3,159 housing units).
- 19,763 U.S. properties started the foreclosure process in September 2024, down 5 percent from the previous month and down 21 percent from September 2023.
- Lenders completed the foreclosure process on 2,624 U.S. properties in September 2024, down 9 percent from the previous month and down 21 percent from September 2023.
U.S. Foreclosure Market Data by State – Q3 2024
| Rate Rank | State Name | Total Properties with Filings | 1/every X HU (Foreclosure Rate) | %∆ Q2 2024 | %∆ Q3 2023 |
| U.S. | 87,108 | 1,618 | -2.64 | -13.37 | |
| 17 | Alabama | 1,326 | 1,732 | 13.24 | -3.21 |
| 45 | Alaska | 72 | 4,410 | -33.33 | -60.44 |
| 20 | Arizona | 1,695 | 1,828 | 12.70 | 9.99 |
| 31 | Arkansas | 541 | 2,536 | -2.17 | -13.99 |
| 13 | California | 10,448 | 1,381 | 2.27 | -4.04 |
| 28 | Colorado | 1,035 | 2,416 | 19.93 | 0.68 |
| 12 | Connecticut | 1,203 | 1,273 | -13.45 | -19.26 |
| 4 | Delaware | 426 | 1,060 | 23.48 | -19.32 |
| 11 | District of Columbia | 281 | 1,247 | -4.42 | -12.46 |
| 3 | Florida | 10,216 | 971 | -0.04 | -2.53 |
| 22 | Georgia | 2,248 | 1,969 | -15.99 | -32.82 |
| 27 | Hawaii | 234 | 2,397 | 14.71 | -4.88 |
| 36 | Idaho | 267 | 2,842 | -11.88 | -3.61 |
| 1 | Illinois | 6,006 | 904 | -2.85 | -3.11 |
| 9 | Indiana | 2,541 | 1,154 | 12.63 | -0.16 |
| 21 | Iowa | 770 | 1,840 | -3.75 | -20.45 |
| 47 | Kansas | 255 | 5,014 | -6.25 | -26.09 |
| 32 | Kentucky | 743 | 2,691 | -8.61 | 10.07 |
| 16 | Louisiana | 1,232 | 1,689 | 0.90 | -12.06 |
| 30 | Maine | 298 | 2,489 | -1.32 | -5.10 |
| 8 | Maryland | 2,236 | 1,132 | -12.49 | -27.47 |
| 23 | Massachusetts | 1,514 | 1,981 | -12.54 | -13.04 |
| 19 | Michigan | 2,522 | 1,816 | 13.86 | -13.66 |
| 34 | Minnesota | 892 | 2,796 | -18.09 | -22.23 |
| 43 | Mississippi | 322 | 4,115 | -18.69 | -27.64 |
| 42 | Missouri | 712 | 3,926 | -16.24 | -36.82 |
| 51 | Montana | 46 | 11,248 | -34.29 | -59.29 |
| 46 | Nebraska | 185 | 4,584 | -19.57 | -39.54 |
| 2 | Nevada | 1,397 | 922 | 11.49 | -10.05 |
| 44 | New Hampshire | 153 | 4,185 | -22.34 | -30.45 |
| 6 | New Jersey | 3,486 | 1,078 | -15.37 | -26.00 |
| 35 | New Mexico | 332 | 2,841 | -20.57 | -34.90 |
| 14 | New York | 5,334 | 1,593 | -0.47 | -19.89 |
| 25 | North Carolina | 2,273 | 2,085 | -3.40 | -26.82 |
| 41 | North Dakota | 103 | 3,615 | -1.90 | 1.98 |
| 10 | Ohio | 4,228 | 1,242 | -4.80 | -22.80 |
| 24 | Oklahoma | 843 | 2,078 | -9.55 | -27.70 |
| 40 | Oregon | 535 | 3,399 | 0.38 | -8.86 |
| 15 | Pennsylvania | 3,467 | 1,660 | -3.85 | -19.89 |
| 26 | Rhode Island | 204 | 2,368 | 119.35 | 11.48 |
| 5 | South Carolina | 2,209 | 1,069 | -2.56 | -20.99 |
| 50 | South Dakota | 35 | 11,233 | -10.26 | -7.89 |
| 33 | Tennessee | 1,110 | 2,749 | -6.57 | -5.93 |
| 18 | Texas | 6,484 | 1,797 | -15.91 | -14.07 |
| 7 | Utah | 1,050 | 1,107 | 58.13 | 72.13 |
| 49 | Vermont | 42 | 7,979 | 13.51 | 162.50 |
| 29 | Virginia | 1,459 | 2,485 | 3.26 | -23.33 |
| 38 | Washington | 1,029 | 3,126 | 8.43 | 11.48 |
| 48 | West Virginia | 108 | 7,955 | -32.08 | -53.85 |
| 37 | Wisconsin | 878 | 3,114 | 19.62 | -6.99 |
| 39 | Wyoming | 83 | 3,293 | 23.88 | -16.16 |
Report methodology
The ATTOM U.S. Foreclosure Market Report provides a count of the total number of properties with at least one foreclosure filing entered into the ATTOM Data Warehouse during the month and quarter. Some foreclosure filings entered into the database during the quarter may have been recorded in the previous quarter. Data is collected from more than 3,000 counties nationwide, and those counties account for more than 99 percent of the U.S. population. ATTOM’s report incorporates documents filed in all three phases of foreclosure: Default — Notice of Default (NOD) and Lis Pendens (LIS); Auction — Notice of Trustee Sale and Notice of Foreclosure Sale (NTS and NFS); and Real Estate Owned, or REO properties (that have been foreclosed on and repurchased by a bank). For the annual, midyear and quarterly reports, if more than one type of foreclosure document is received for a property during the timeframe, only the most recent filing is counted in the report. The annual, midyear, quarterly and monthly reports all check if the same type of document was filed against a property previously. If so, and if that previous filing occurred within the estimated foreclosure timeframe for the state where the property is located, the report does not count the property in the current year, quarter or month.
About ATTOM
ATTOM delivers AI-driven property intelligence built on one of the nation's most trusted property data assets, covering 158 million U.S. properties—99% of the population. Our engineered, multi-sourced real estate data spans property tax, deeds, mortgages, foreclosure, environmental risk, property conditions, natural hazards, neighborhood insights, and geospatial boundaries, rigorously validated for advanced analytics. ATTOM supports analytics and AI-driven applications through flexible delivery options including APIs, bulk licensing, cloud delivery, market trend products, and the MCP Server for AI-powered, agentic access to engineered property data—enabling organizations to automate analysis and scale property intelligence across industries.
Media Contact:
Megan Hunt
megan.hunt@attomdata.com
Data and Report Licensing:
datareports@attomdata.com
See January 2025 US Foreclosure Rates by State