
Equity Rich Properties Represent 25.6 Percent of U.S. Properties; Share of Seriously Underwater Properties Drops to 8.8 Percent; Report Includes Home Equity Breakdown by Zip Code
IRVINE, Calif. — Feb. 7, 2019 — ATTOM Data Solutions, curator of the nation’s premier property database, today released its Year-End 2018 U.S. Home Equity & Underwater Report, which shows that in the fourth quarter of 2018, over 14.5 million U.S. properties were equity rich — where the combined estimated amount of loans secured by the property was 50 percent or less of the property’s estimated market value — up by more than 834,000 from a year ago to a new high as far back as data is available, Q4 2013.
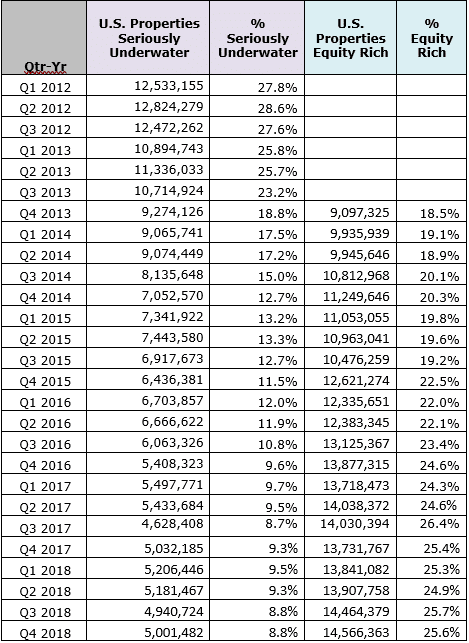
The 14.5 million equity rich properties in Q4 2018 represented 25.6 percent of all properties with a mortgage, down slightly from 25.7 percent in the previous quarter but up from 25.4 percent in Q4 2017.
The report also shows more than 5 million U.S. properties were seriously underwater — where the combined estimated balance of loans secured by the property was at least 25 percent higher than the property’s estimated market value, representing 8.8 percent of all U.S. properties with a mortgage. That 8.8 percent share of seriously underwater homes remained unchanged from the previous quarter and down from 9.3 percent in Q4 2017.
“With homeowners staying put longer, homeownership equity will most likely continue to strengthen. Those that are seriously underwater may find themselves coming up for air as they continue to pay off excessive legacy mortgages or sell,” said Todd Teta, chief product officer with ATTOM Data Solutions. “This report helps to showcase a story of the West coast markets having the highest share of equity rich homeowners versus the South and Midwest markets, who continue to have stubbornly high rates of seriously underwater homeowners.”
Historical U.S. Underwater & Equity Rich Trends
Highest seriously underwater share in Louisiana, Mississippi, Arkansas, Illinois, Iowa
States with the highest share of mortgages that were seriously underwater included; Louisiana (20.8 percent); Mississippi (16.9 percent); Arkansas (15.9 percent); Illinois (15.6 percent); and Iowa (15.2 percent).
Among 98 metropolitan statistical areas analyzed in the report, those with the highest share of mortgages that were seriously underwater included; Baton Rouge, Louisiana (20.7 percent); Youngstown, Ohio (19.0 percent); New Orleans, Louisiana (19.0 percent); Toledo, Ohio (18.0 percent); and Scranton, Pennsylvania (17.7 percent).
27 zip codes where more than half of all properties are seriously underwater
Among 7,590 U.S. zip codes with at least 2,500 properties with mortgages, there were 27 zip codes where more than half of all properties with a mortgage were seriously underwater, including zip codes in the Chicago, Cleveland, Saint Louis, Atlantic City, Detroit and Virginia Beach metropolitan statistical areas.
The top five zip codes with the highest share of seriously underwater properties were 08611 in Trenton, New Jersey (70.3 percent seriously underwater); 63137 in Saint Louis, Missouri (64.8 percent); 60426 in Harvey, Illinois (62.3 percent); 38106 in Memphis, Tennessee (60.5 percent); and 61104 in Rockford, Illinois (59.6 percent).
Q4 2018 Underwater Properties Heat Map by ZIP
Highest equity rich share in California, Hawaii, New York, Washington, Oregon
States with the highest share of equity rich properties were California (43.6 percent); Hawaii (39.3 percent); New York (34.2 percent); Washington (34.2 percent); and Oregon (32.9 percent).
Among 98 metropolitan statistical areas analyzed in the report, those with the highest share of equity rich properties were San Jose, California (72.0 percent); San Francisco, California (60.7 percent); Los Angeles, California (48.5 percent); Honolulu, Hawaii (40.2 percent); and Oxnard, California (39.2 percent).
7 Out of the top 10 equity rich counties resided in California
Among the 1,479 counties with at least 2,500 properties with mortgages, those top 10 counties with the highest percent of equity rich properties resided mainly in California counties.
The top five counties with the highest share of equity rich properties were San Mateo, California (75.9 percent); Santa Clara, California (73.0 percent); San Francisco, California (71.4 percent); Pasquotank, North Carolina (65.7 percent); and Alameda, California (62.7 percent).
427 zip codes where more than half of all properties are equity rich
Among 7,590 U.S. zip codes with at least 2,500 properties with mortgages, there were 427 zip codes where more than half of all properties with a mortgage were equity rich.
The top five zip codes with the highest share of equity rich properties were all in the California Bay area: 94116 in San Francisco (85.0 percent); 94087 in Sunnyvale (84.6 percent equity rich); 94040 in Mountain View (83.5 percent equity rich); 94043 in Mountain View (83.0 percent equity rich); and 95051 in Santa Clara (82.7 percent equity rich).
Q4 2018 Equity Rich Properties Heat Map by ZIP
Report methodology
The ATTOM Data Solutions U.S. Home Equity & Underwater report provides counts of properties based on several categories of equity — or loan to value (LTV) — at the state, metro, county and zip code level, along with the percentage of total properties with a mortgage that each equity category represents. The equity/LTV is calculated based on record-level loan model estimating position and amount of loans secured by a property and a record-level automated valuation model (AVM) derived from publicly recorded mortgage and deed of trust data collected and licensed by ATTOM Data Solutions nationwide for more than 155 million U.S. properties.
Definitions
Seriously underwater: Loan to value ratio of 125 percent or above, meaning the property owner owed at least 25 percent more than the estimated market value of the property.
Equity rich: Loan to value ratio of 50 percent or lower, meaning the property owner had at least 50 percent equity.
About ATTOM Data Solutions
ATTOM Data Solutions provides premium property data to power products that improve transparency, innovation, efficiency and disruption in a data-driven economy. ATTOM multi-sources property tax, deed, mortgage, foreclosure, environmental risk, natural hazard, and neighborhood data for more than 155 million U.S. residential and commercial properties covering 99 percent of the nation’s population. A rigorous data management process involving more than 20 steps validates, standardizes and enhances the data collected by ATTOM, assigning each property record with a persistent, unique ID — the ATTOM ID. The 9TB ATTOM Data Warehouse fuels innovation in many industries including mortgage, real estate, insurance, marketing, government and more through flexible data delivery solutions that include bulk file licenses, APIs, market trends, marketing lists, match & append and more.
Media Contact:
Christine Stricker
949.748.8428
christine.stricker@attomdata.com
Data and Report Licensing:
949.502.8313