According to ATTOM Data Solutions’ just released May 2019 U.S. Foreclosure Report, foreclosure filings — default notices, scheduled auctions and bank repossessions — were reported on 56,152 U.S. properties in May 2019. That number is up 1 percent from April 2019 but down 22 percent from May 2018, for the 11th consecutive month with an annual decline.
Also cited in our foreclosure report are lenders completing the foreclosure process (REOs) on 10,634 U.S. properties in May 2019. That number is down 4 percent from April 2019 and down 50 percent from May 2018 – a 7th consecutive annual decline.
Except for Vermont, the rest of the states across the nation saw annual declines in completed foreclosures. Those that saw an annual decline of more than 50 percent in REOs included Michigan (down 84 percent); Massachusetts (down 74 percent); Indiana (down 67 percent); Kentucky (down 66 percent); and New Jersey (down 64 percent).
The report also showed that nationwide one in every 2,411 housing units had a foreclosure filing in May 2019.
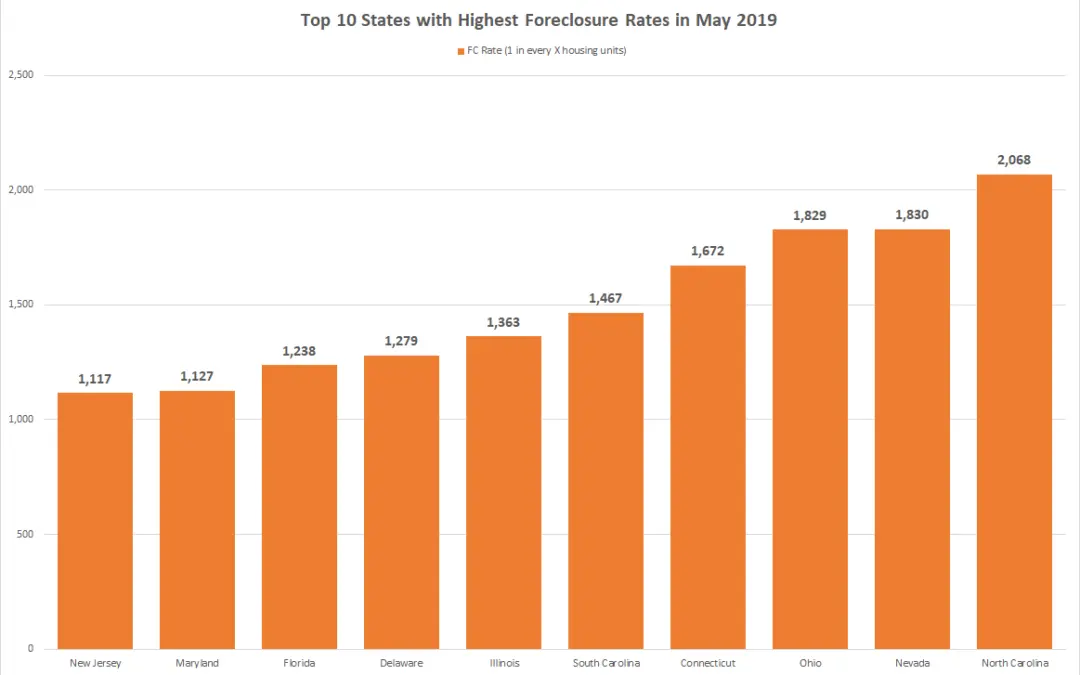
The states with the highest foreclosure rates were New Jersey (one in every 1,117 housing units with a foreclosure filing); Maryland (one in every 1,127 housing units); Florida (one in every 1,238 housing units); Delaware (one in every 1,279 housing units); and Illinois (one in every 1,363 housing units).
What are the other states that rank in the top 10 with the highest or worst foreclosure rates?

Among 220 metropolitan statistical areas with a population of at least 200,000, those with the highest foreclosure rates in May 2019 were Atlantic City, New Jersey (one in every 680 housing units with a foreclosure filing); Jacksonville, Florida (one in every 764 housing units); Fayetteville, North Carolina (one in every 777 housing units); Columbia, South Carolina (one in every 936 housing units); and Rockford, Illinois (one in every 941 housing units).
Want to see how your area ranks in foreclosure rate? Or drill down even further to discover foreclosure trends at the county, city or zip code level? Contact us now to see how you can get this data!
