Foreclosure Starts Continue Upward Trend in Florida; New Jersey, Maryland and Florida Rank Highest in Foreclosure Rate; Overall Foreclosure Activity Decreases 22 Percent from a Year Ago
IRVINE, Calif. – June 13, 2019 – ATTOM Data Solutions, curator of the nation’s premier property database and first property data provider of Data-as-a-Service (DaaS), today released its May 2019 U.S. Foreclosure Market Report, which shows foreclosure filings — default notices, scheduled auctions and bank repossessions — were reported on 56,152 U.S. properties in May 2019, up 1 percent from the previous month but down 22 percent from a year ago for the 11th consecutive month with an annual decline.
“We are continuing to see a downward trend with overall foreclosure activity, especially in completed foreclosures declining year after year,” said Todd Teta, chief product officer at ATTOM Data Solutions. “However, in May 2019 we did see an uptick in the number of states increasing in foreclosure starts going from 17 to 23 states rising annually, and again Florida is bucking the national trend with a continuous annual increase.”
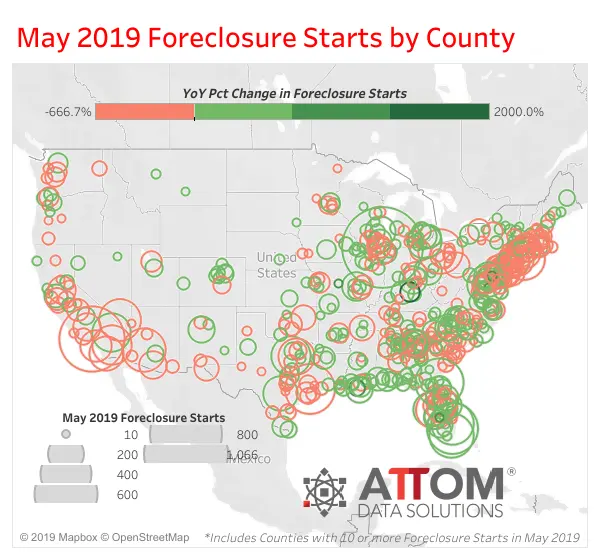
May 2019 Foreclosure Starts by County
Foreclosure completions decline annually in every state except Vermont
Lenders completed foreclosures (REO) on 10,634 U.S. properties in May 2019, down 4 percent from the previous month and down 50 percent from a year ago – a 7th consecutive annual decline.
States across the nation, except for Vermont all saw annual declines in completed foreclosures. Those that saw an annual decline of more than 50 percent in REOs included Michigan (down 84 percent); Massachusetts (down 74 percent); Indiana (down 67 percent); Kentucky (down 66 percent); and New Jersey (down 64 percent).
In looking at those greater metropolitan areas with a population of 200,000 or more and those that had at least 100 completed foreclosures in May 2019, with double-digit decreases were Birmingham, Alabama (down 67 percent); New York, New York (down 59 percent); Washington, DC (down 58 percent); Philadelphia, Pennsylvania (down 57 percent); and Detroit, Michigan (down 54 percent).
Florida foreclosure starts continuing double-digit annual increase
Lenders started the foreclosure process on 30,554 U.S. properties in May 2019, while slightly up (less than 1 percent) from last month they are down 9 percent from May 2018 –fourth consecutive month with an annual decline.
Counter to the national trend states that saw an increase in foreclosure starts in May 2019 were Wisconsin (up 99 percent); Kentucky (up 64 percent); Louisiana (up 53 percent); Missouri (up 34 percent); and Florida (up 23 percent). This is the 12th consecutive month that Florida has seen double-digit annual increases in foreclosure starts.
“To put the numbers in perspective, I would use a full year, perhaps 2006 as a “normal” benchmark number. That would be the last year before the real estate world crashed,” said Bruce Norris, president of The Norris Group. “The total foreclosure starts for Florida in 2006 was 102,875. In 2018, there were 33,031 foreclosure starts. Even at a 25% increase over 2018, 2019 will still be less than 50% of 2006. An increase of some 8,000 foreclosure starts is not a game changer at this point.”
States that posted annual decreases in foreclosure starts in May 2019, included Texas (down 39 percent); Pennsylvania (down 38 percent); Massachusetts (down 34 percent); Oklahoma (down 29 percent); and New York (down 25 percent).
Those major metropolitan statistical areas with a population greater than 1,000,000 that saw an annual decrease in foreclosure starts included Indianapolis, Indiana (down 82 percent); Houston, Texas (down 65 percent); San Jose, California (down 58 percent); Austin, Texas (down 41 percent); and Philadelphia, Pennsylvania (down 34 percent).
New Jersey, Maryland and Florida rank top 3 in worst foreclosure rate
Nationwide one in every 2,411 housing units had a foreclosure filing in May 2019.
States with the highest foreclosure rates were New Jersey (one in every 1,117 housing units with a foreclosure filing); Maryland (one in every 1,127 housing units); Florida (one in every 1,238 housing units); Delaware (one in every 1,279 housing units); and Illinois (one in every 1,363 housing units).
Among 220 metropolitan statistical areas with a population of at least 200,000, those with the highest foreclosure rates in May 2019 were Atlantic City, New Jersey (one in every 680 housing units with a foreclosure filing); Jacksonville, Florida (one in every 764 housing units);
Fayetteville, North Carolina (one in every 777 housing units); Columbia, South Carolina (one in every 936 housing units); and Rockford, Illinois (one in every 941 housing units).
Report methodology
The ATTOM Data Solutions U.S. Foreclosure Market Report provides a count of the total number of properties with at least one foreclosure filing entered into the ATTOM Data Warehouse during the month and quarter. Some foreclosure filings entered into the database during the quarter may have been recorded in the previous quarter. Data is collected from more than 2,200 counties nationwide, and those counties account for more than 90 percent of the U.S. population. ATTOM’s report incorporates documents filed in all three phases of foreclosure: Default — Notice of Default (NOD) and Lis Pendens (LIS); Auction — Notice of Trustee Sale and Notice of Foreclosure Sale (NTS and NFS); and Real Estate Owned, or REO properties (that have been foreclosed on and repurchased by a bank). For the annual, midyear and quarterly reports, if more than one type of foreclosure document is received for a property during the timeframe, only the most recent filing is counted in the report. The annual, midyear, quarterly and monthly reports all check if the same type of document was filed against a property previously. If so, and if that previous filing occurred within the estimated foreclosure timeframe for the state where the property is located, the report does not count the property in the current year, quarter or month.
About ATTOM Data Solutions
ATTOM Data Solutions provides premium property data to power products that improve transparency, innovation, efficiency and disruption in a data-driven economy. ATTOM multi-sources property tax, deed, mortgage, foreclosure, environmental risk, natural hazard, and neighborhood data for more than 155 million U.S. residential and commercial properties covering 99 percent of the nation’s population. A rigorous data management process involving more than 20 steps validates, standardizes and enhances the data collected by ATTOM, assigning each property record with a persistent, unique ID — the ATTOM ID. The 9TB ATTOM Data Warehouse fuels innovation in many industries including mortgage, real estate, insurance, marketing, government and more through flexible data delivery solutions that include bulk file licenses, APIs, market trends, marketing lists, match & append and introducing the first property data deliver solution, a cloud-based data platform that streamlines data management – Data-as-a-Service (DaaS).
Media Contact:
Christine Stricker
949.748.8428
christine.stricker@attomdata.com
Data and Report Licensing:
949.502.8313