
Median home prices in Q1 2018 were not affordable for average wage earners in 304 of 446 U.S. counties (68 percent) analyzed in the most recent home affordability report from ATTOM Data Solutions, and on average across those 446 counties an average wage earner would need to spend 37.2 percent of his or her wages to buy a median-priced home. We combined 2017 net migration data from the Census Bureau to ascertain how how home affordability plays out in the top markets with population departing and the top markets with population arriving.
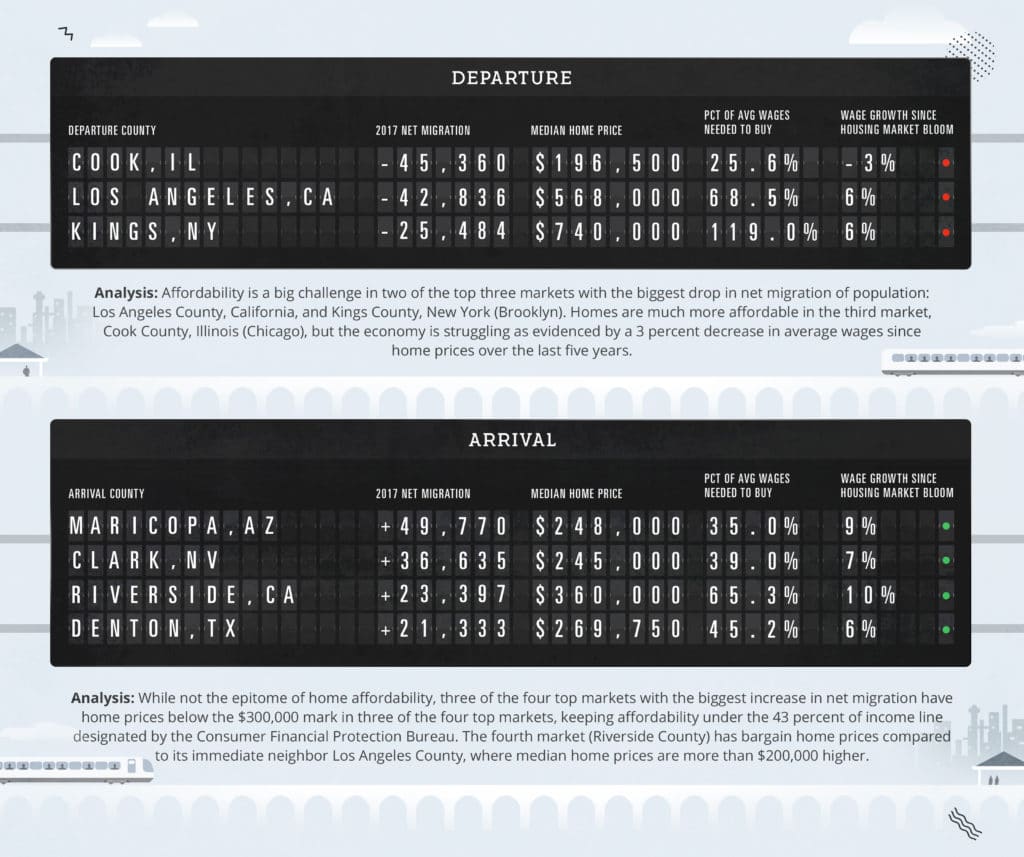
Population is migrating away from high-priced, less affordable markets such as Los Angeles County, California and Kings County, New York (Brooklyn) as well as from markets where the economy is struggling, such as Cook County, Illinois (Chicago) — as evidenced by weak wage growth.
Meanwhile population is migrating to markets that are more reasonably priced with median prices in the $250,000 to $300,000 range in three of the four top markets with the biggest positive net migration in 2017 — Maricopa County, Arizona (Phoenix); Clark County, Nevada (Las Vegas); and Denton County, Texas (Dallas). The fourth market on that list — Riverside County, California in “Inland Empire” of Southern California — has a higher median price of $360,000, but that is a bargain compared to nearby Los Angeles and Orange counties. Riverside County also has relatively strong wage growth as do the other three markets on the top arrivals list.
Home Affordability Index Infographic
The ATTOM Data Solutions U.S. Home Affordability Index analyzes median home prices derived from publicly recorded sales deed data collected by ATTOM Data Solutions and average wage data from the U.S. Bureau of Labor Statistics. Affordability is based on the percentage of average wages needed to make monthly house payments on a median-priced home with a 30-year fixed rate mortgage and a 3 percent down payment, including property taxes, home insurance and mortgage insurance. Net migration data is from the U.S. Census Bureau and is the difference between the number of people moving into a county and the number of people moving out of a county in 2017.
