
Home sales over last ten years prove spring and summer months offer best premiums; Home sellers on average realize 8.8 percent premium above market value
IRVINE, Calif. — May 4, 2021 — ATTOM Data Solutions, curator of the nation’s premier property database, today released its annual analysis of the best days of the year to sell a home, which shows that the months of May and June offer the greatest home seller premiums – with ten of the best days to sell in the month of May alone.
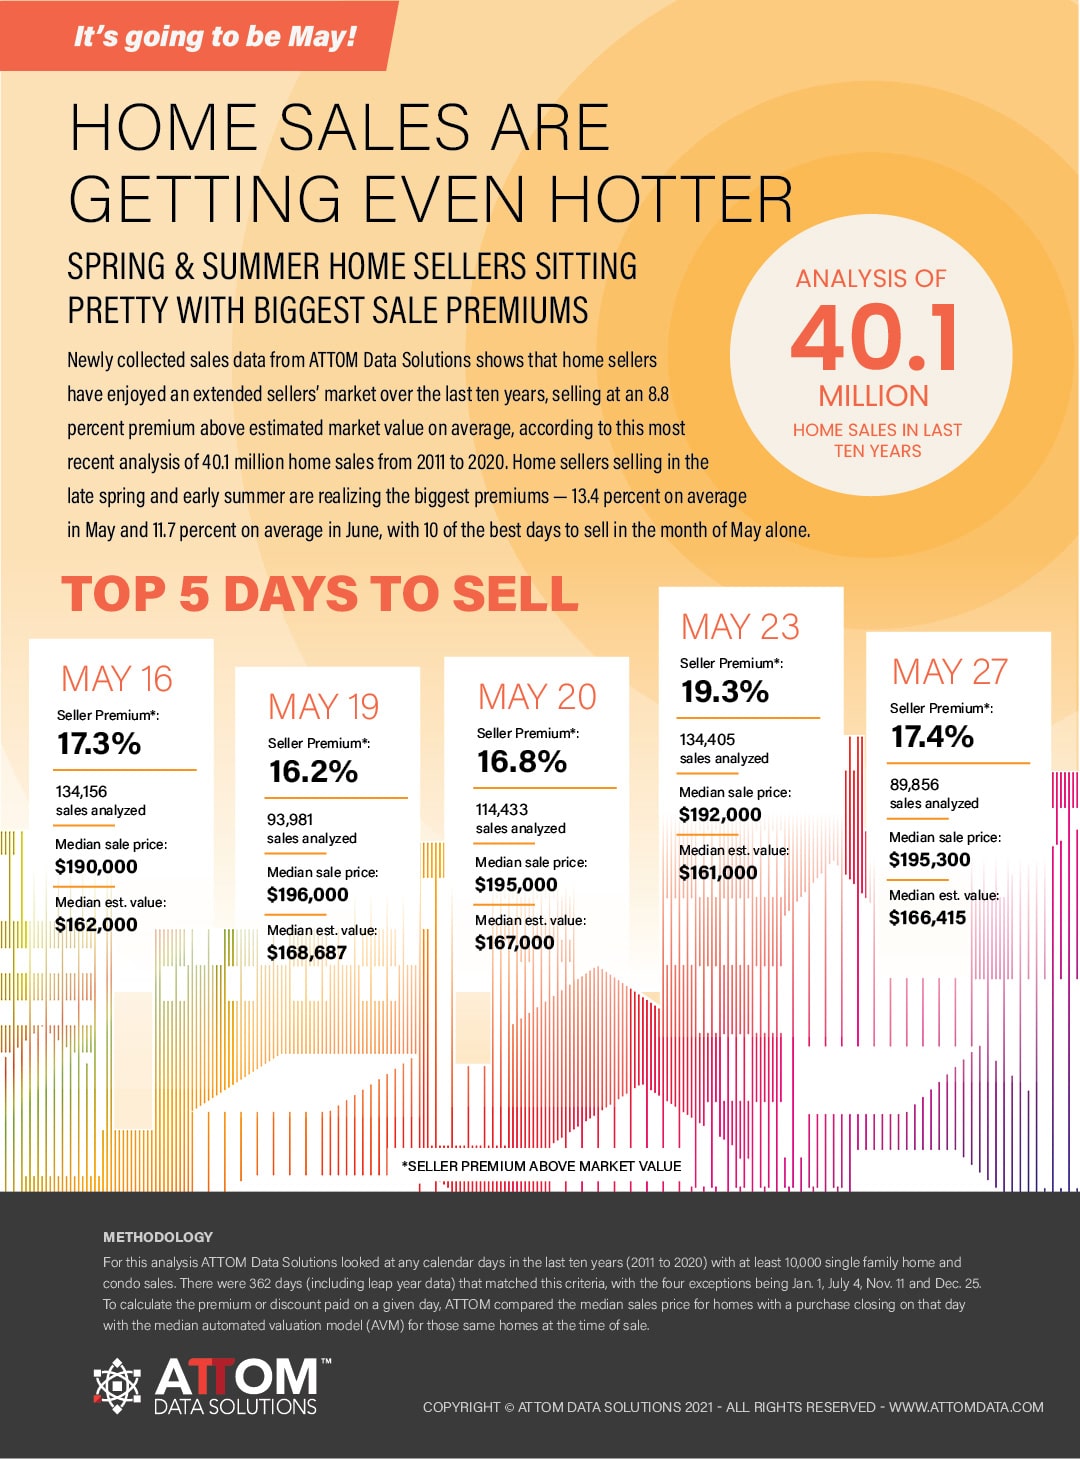
According to this most recent analysis of 40.1 million home sales from 2011-2020, home sellers selling in the late spring and early summer are realizing the biggest premiums – on average 13.4 percent above estimated market value in May and 11.7 percent above in June. The analysis looked at any calendar days in the last ten years with at least 10,000 single family home and condo sales. (See full methodology below.)
“As home sellers continue to enjoy an extended sellers’ market, moving full steam ahead from the momentum gained over the last ten years, the month of May is particularly poised to garner the greatest sale premiums,” said Todd Teta, chief product officer with ATTOM Data Solutions. “Among the top five days fetching the biggest home seller premiums, May 23 is the best day of the year to sell a home, producing a premium of 19.3 percent above market value.”
Best Months to Sell
The analysis also presents a more high-level view, showcasing how seller premiums faired throughout each month of the year.
The months realizing the biggest home seller premiums include: May (13.4 percent); June (11.7 percent); July (11.2 percent); April (9.2 percent); August (8.9 percent); March (8.6 percent); February (8.2 percent); September (7.5 percent); January (6.6 percent); November (6.4 percent); October (5.8 percent); and December (5.8 percent).
| 2011 to 2020 Sales of Single Family Homes and Condos | ||||
| Month | Number of Sales | Median Sales Price | Median AVM | Seller Premium |
| May | 3,646,841 | $ 197,400 | $ 174,000 | 13.4% |
| June | 3,967,058 | $ 206,000 | $ 184,500 | 11.7% |
| July | 3,926,975 | $ 209,000 | $ 188,000 | 11.2% |
| April | 3,287,804 | $ 190,000 | $ 174,000 | 9.2% |
| August | 3,977,547 | $ 205,000 | $ 188,246 | 8.9% |
| March | 3,158,578 | $ 185,000 | $ 170,340 | 8.6% |
| February | 2,408,981 | $ 177,510 | $ 164,000 | 8.2% |
| September | 3,504,546 | $ 201,000 | $ 187,000 | 7.5% |
| January | 2,495,898 | $ 178,058 | $ 167,000 | 6.6% |
| November | 3,037,403 | $ 200,000 | $ 188,000 | 6.4% |
| October | 3,557,622 | $ 200,000 | $ 188,979 | 5.8% |
| December | 3,218,651 | $ 200,000 | $ 189,000 | 5.8% |
Methodology
For this analysis ATTOM Data Solutions looked at any calendar days in the last ten years (2011 to 2020) with at least 10,000 single family home and condo sales. There were 362 days (including leap year data) that matched this criteria, with the four exceptions being Jan. 1, July 4, Nov. 11 and Dec. 25. To calculate the premium or discount paid on a given day, ATTOM compared the median sales price for homes with a purchase closing on that day with the median automated valuation model (AVM) for those same homes at the time of sale.
About ATTOM
ATTOM delivers AI-driven property intelligence built on one of the nation's most trusted property data assets, covering 158 million U.S. properties—99% of the population. Our engineered, multi-sourced real estate data spans property tax, deeds, mortgages, foreclosure, environmental risk, property conditions, natural hazards, neighborhood insights, and geospatial boundaries, rigorously validated for advanced analytics. ATTOM supports analytics and AI-driven applications through flexible delivery options including APIs, bulk licensing, cloud delivery, market trend products, and the MCP Server for AI-powered, agentic access to engineered property data—enabling organizations to automate analysis and scale property intelligence across industries.
Media Contact:
Christine Stricker
949.748.8428
christine.stricker@attomdata.com
Data and Report Licensing:
949.502.8313