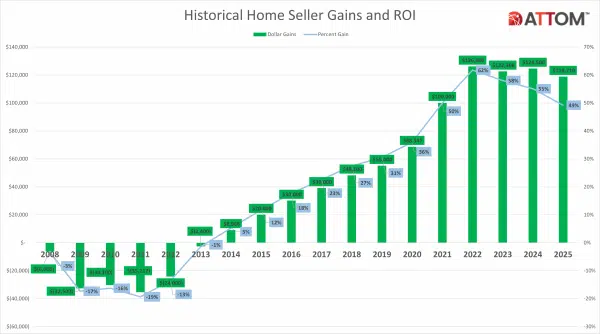
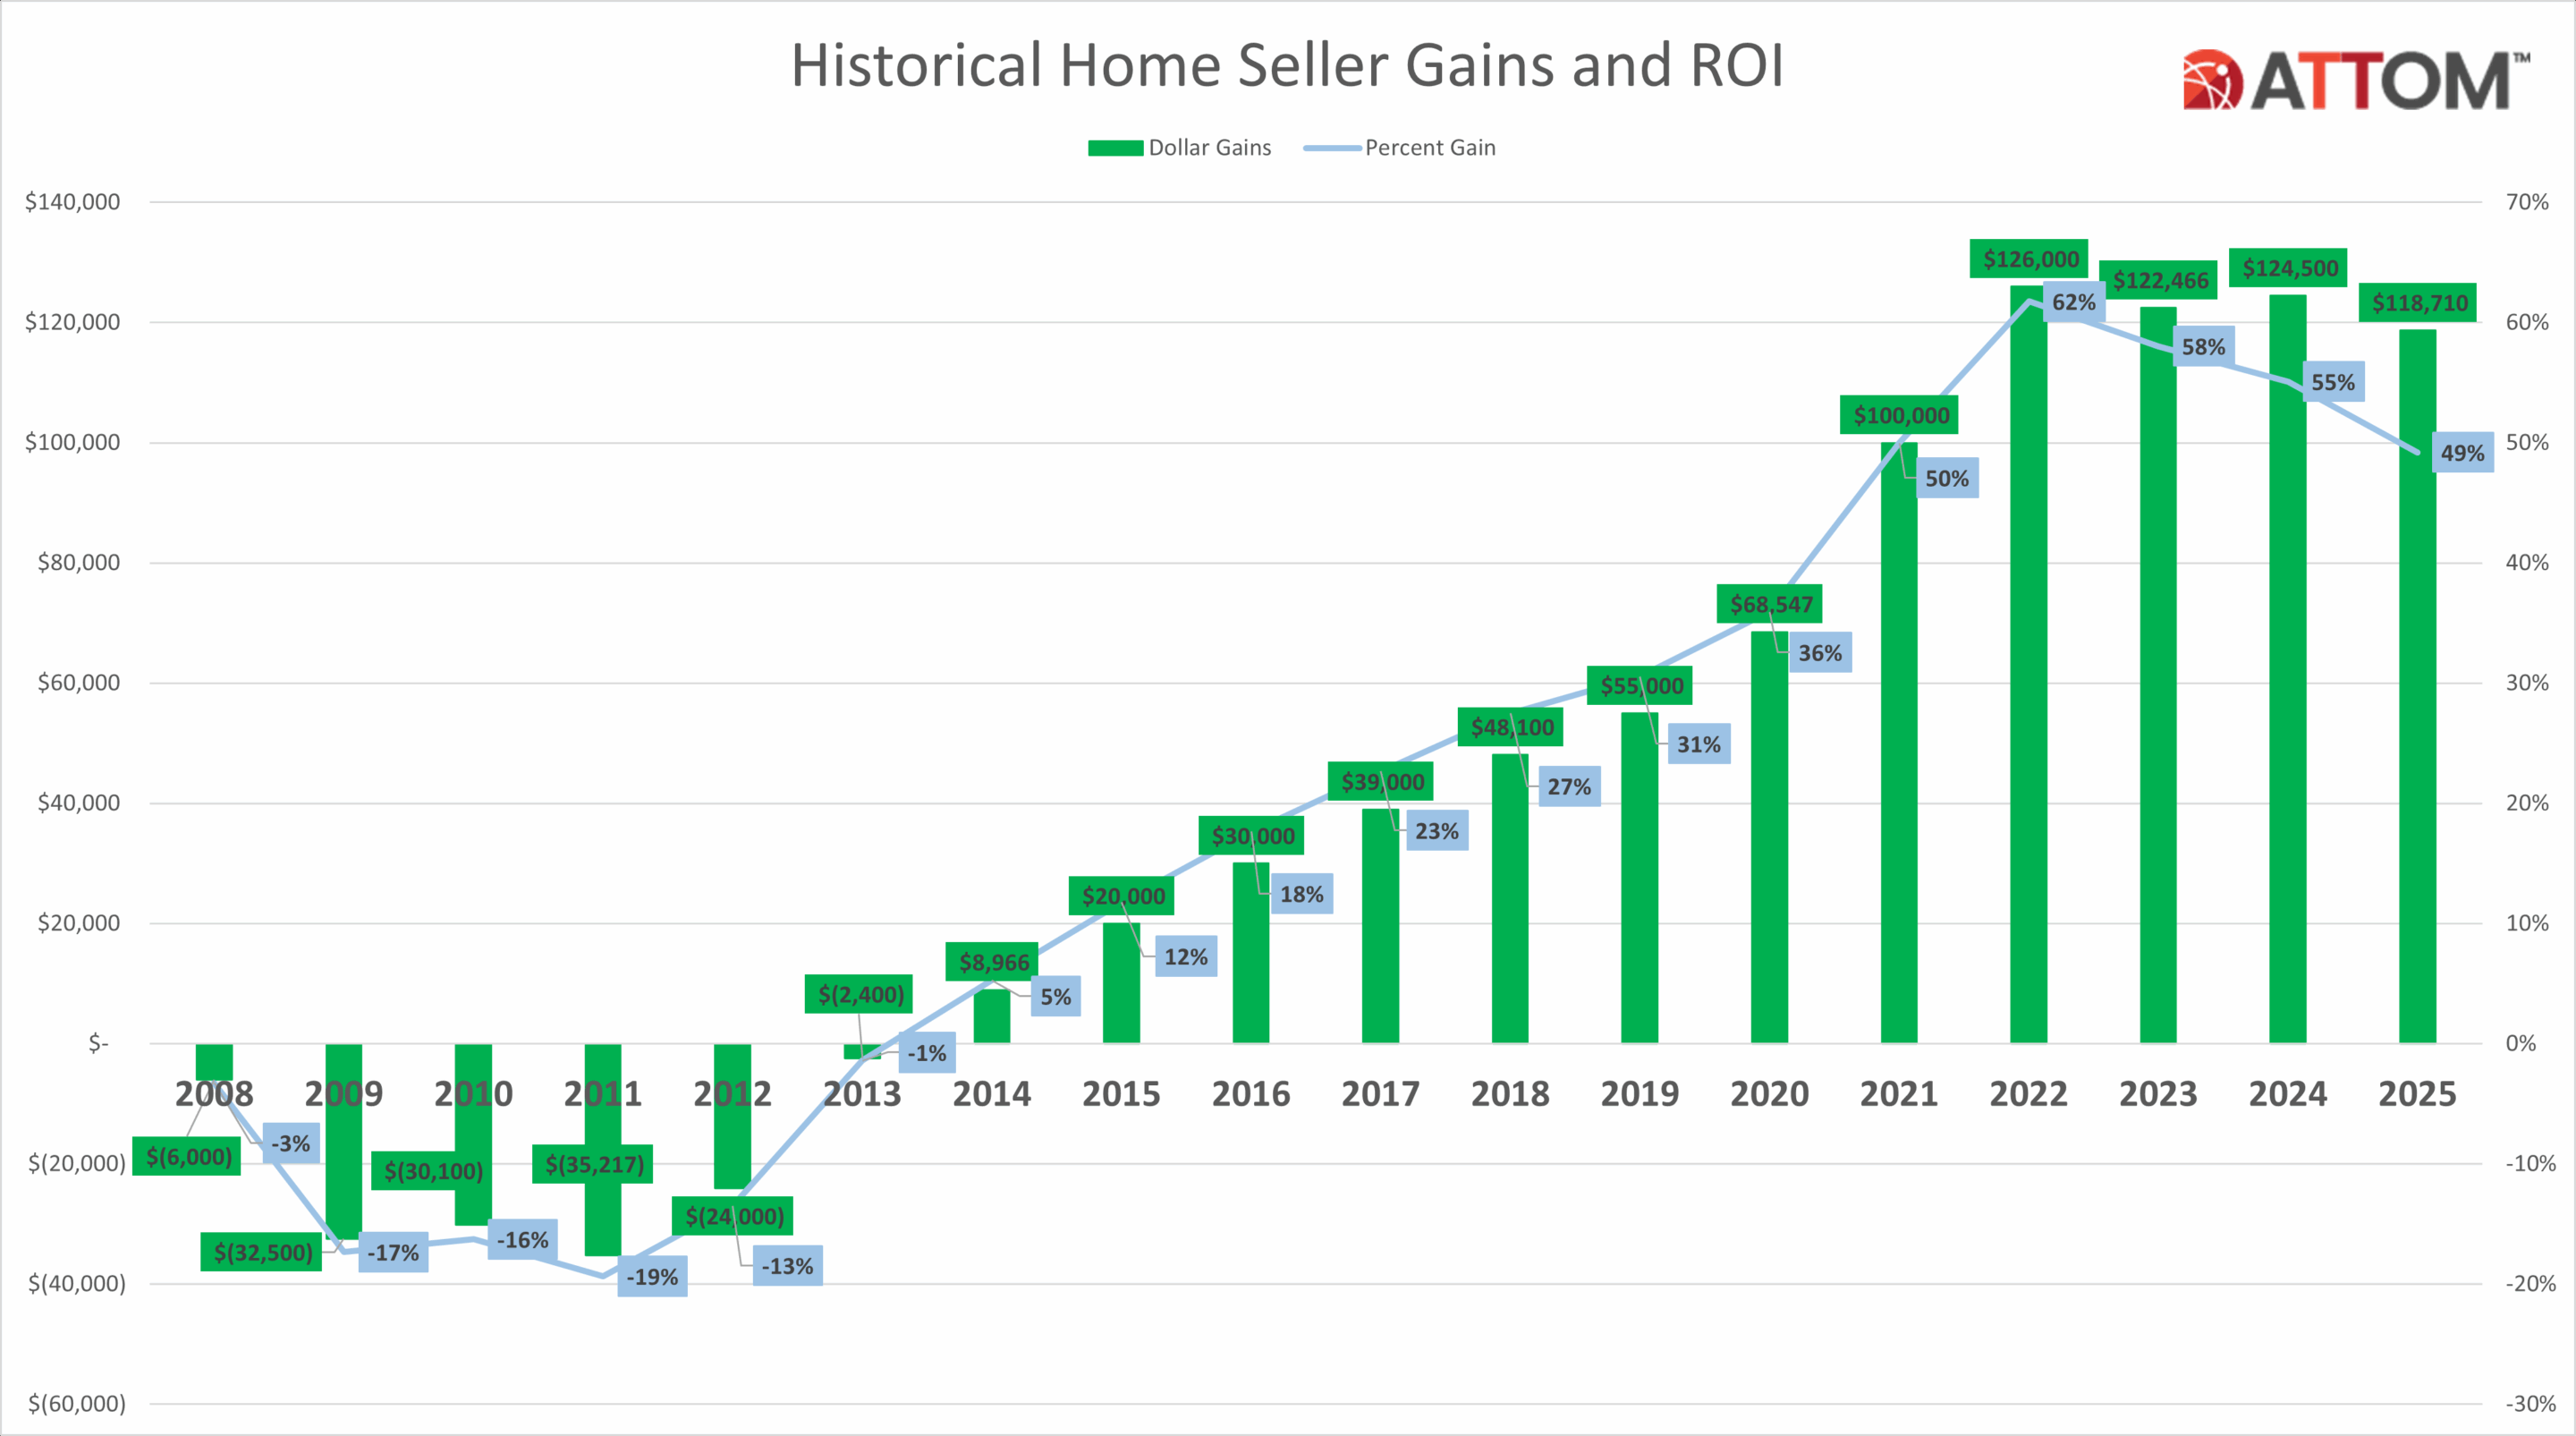
Profit margins from home sales fell from 55 percent in 2024 to 49 percent in 2025; Institutional investors purchased 6.6 percent of all homes sold
IRVINE, Calif. – Jan. 29, 2026 — ATTOM, a leading curator of land, property data, and real estate analytics, today released its Year-End 2025 U.S. Home Sales Report, which shows that 3.9 million homes were sold last year, with a record high national median sale price of $360,000; that was 2.6 percent higher than 2024 and 39 percent higher than 2020.
While prices reached new peaks in 2025, profit margins did not. The typical home netted $118,710 in gross profits, generating a 49 percent return on investment. That was down from a gross profit of $124,500 and a profit margin of 55 percent in 2024.
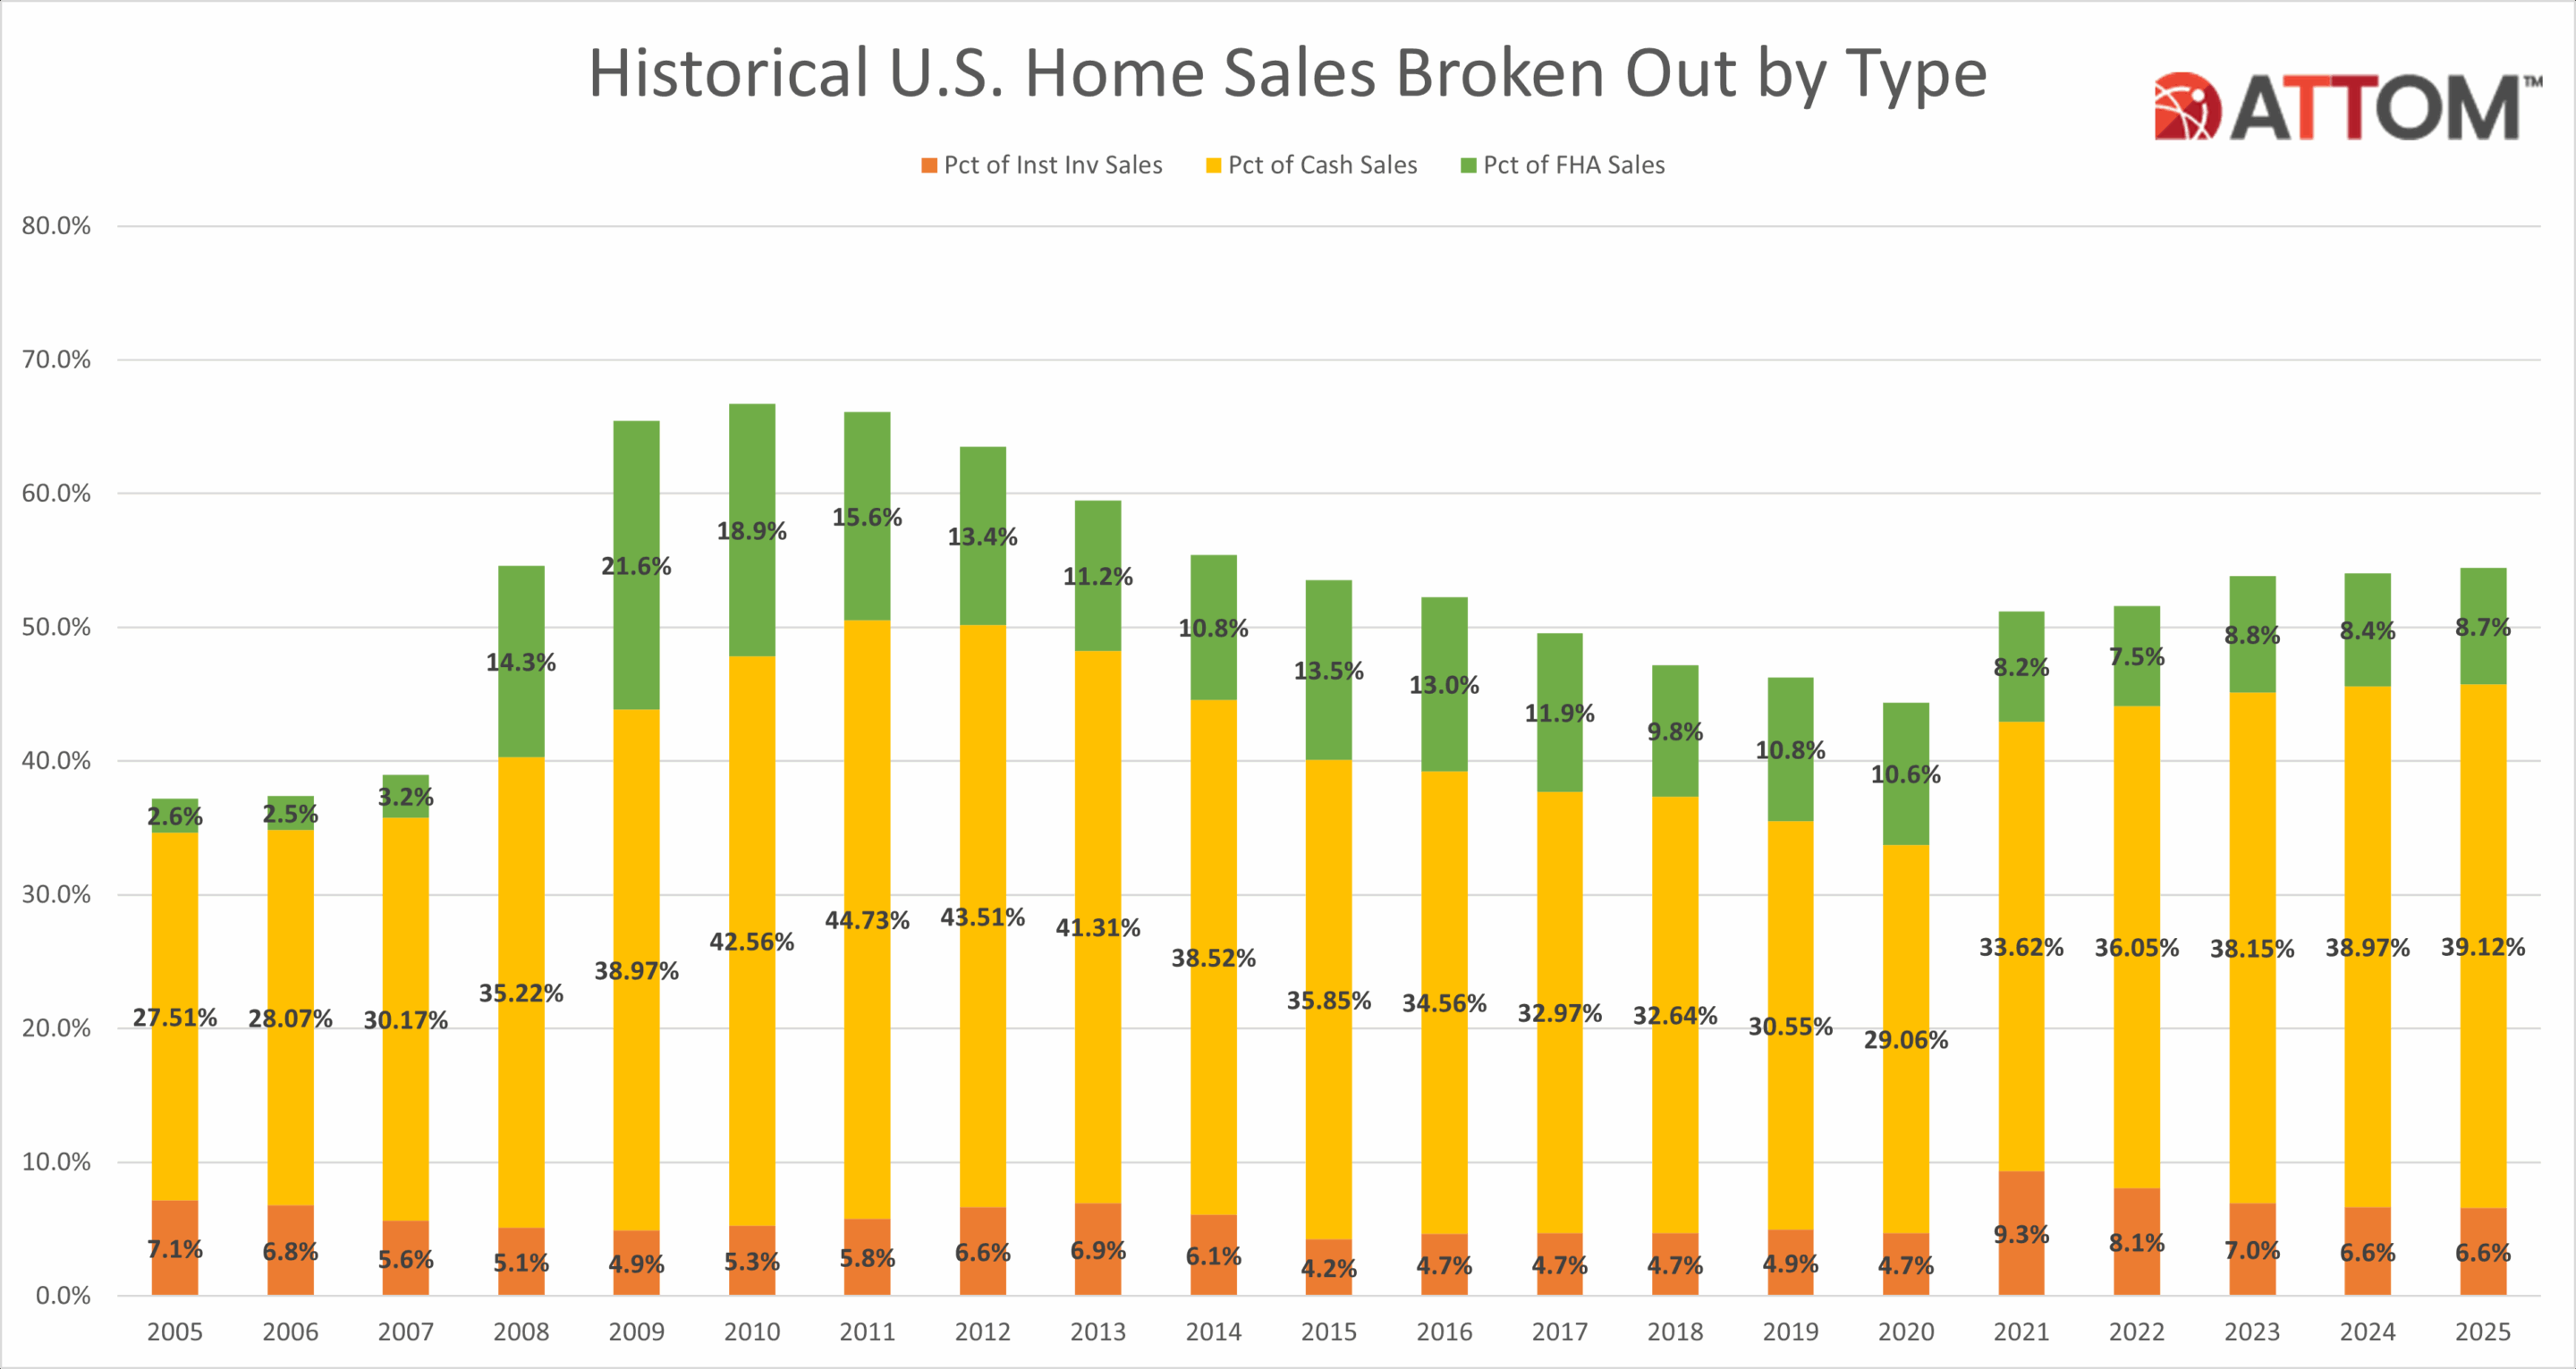
The share of homes bought by institutional investors (as a percent of all sales) hovered below 5 percent for years, until it nearly doubled to 9.3 percent in 2021 as the COVID-19 pandemic ignited the housing market. It has been declining since then, but held steady in 2024 and 2025 at 6.6 percent, according to the latest data.
“Home prices kept climbing in 2025 even as affordability challenges intensified for households across the country,” said Rob Barber, CEO of ATTOM. “While sellers continued to command record prices, profit margins have been declining for three consecutive years since peaking in 2022, suggesting the market may be gradually normalizing after a period of strong returns.”
“Recent declines in mortgage rates likely provided some relief for prospective buyers,” Barber added, “but with prices at record highs and ownership tenures stretching longer, that relief may be limited.”
Home prices up in more than three quarters of metros
Median sales prices were up compared to 2024 in 80.5 percent (107) of the 133 metropolitan statistical areas analyzed. Metro areas were included in the report if they had populations over 200,000 and at least 5,000 sales.
The metro areas that saw the largest year-over-year increases in home prices were Birmingham, AL (median sales price up 12.9 percent); Syracuse, NY (up 11.6 percent); Toledo, OH (up 10.4 percent); Rochester, NY (up 10.3 percent); and Dayton, OH (up 10.3 percent).
In addition to Birmingham and Rochester, the largest increases among metros with populations over 1 million came in Detroit, MI (up 8.5 percent), Tulsa, OK (up 8.2 percent); and Kansas City, MO (up 8.1 percent).
The metro areas where median prices decreased the most between 2024 and 2025 were North Port, FL (down 9 percent); Deltona, FL (down 5.4 percent); Stockton, CA (down 4.7 percent); Huntsville, AL (down 4.1 percent); and Cape Coral, FL (down 3.9 percent).
Share of sales to institutional investors holds steady
In 2025, for the second year in a row, institutional investors purchased 6.6 percent of all homes sold in the U.S., with particularly high rates in Tennessee and Texas (9.2 percent of all sales); Missouri (9.1 percent); Indiana (9 percent); and Georgia, Alabama, and Oklahoma (8.8 percent).
The metro areas with the highest share of sales to institutional investors in 2025 were Memphis, TN (14.8 percent of all sales); Huntsville, AL (11.9 percent); Fayetteville, NC (11.4 percent); Birmingham, AL (11.2 percent); and Dallas, TX (11.1 percent).
Widespread drop in home sale profits, Florida metros hit hardest
Profit margins on a median-priced home sale were lower in 2025 than 2024 in 87.7 percent (114) of the 130 metro areas with sufficient data to analyze.
Nine out of the 10 metro areas that saw the largest declines in profit margins were in Florida, led by North Port, FL (typical profit margins down 24 percentage points to 45 percent in 2025); Cape Coral, FL (down 22 percentage points to 56 percent); Deltona, FL (down 22 percentage points to 51 percent); Palm Bay, FL (down 19 percentage points to 56 percent); and Port St. Lucie, FL (down 16 percentage points to 64 percent).
Among metros with populations over 1 million, the largest profit margin declines came in Tampa, FL (down 15 percentage points to 58 percent); Jacksonville, FL (down 13 percentage points to 45 percent); Fresno, CA (down 12 percentage points to 62 percent); San Jose, CA (down 12 percentage points to 94 percent); and Miami, FL (down 11 percentage points to 72 percent).
The metro areas that saw the largest year-over-year growth on typical home sale profit margins were Canton, OH (up 5 points to 54 percent); Akron, OH (up 3 points to 59 percent); Chicago, IL (up 2 points to 47 percent); Cleveland, OH (up 2 points to 61 percent); and South Bend, IN (up 2 points to 59 percent).
Gross profits, the dollar difference between what an owner purchased and sold a home for, fell year-over-year in 64.6 percent (84) of the 130 metro areas with sufficient data to analyze.
The metro areas with the largest gross profits from median home sales in 2025 were San Jose, CA ($755,000); San Francisco, CA ($463,500); San Diego, CA ($346,000); Los Angeles, CA ($345,000); and Seattle, WA ($317,869).
Those with the smallest typical gross profits were Beaumont, TX ($23,668); New Orleans, LA ($40,000); Peoria, IL ($45,000); Baton Rouge, LA ($48,500); and Killeen, TX ($50,240).
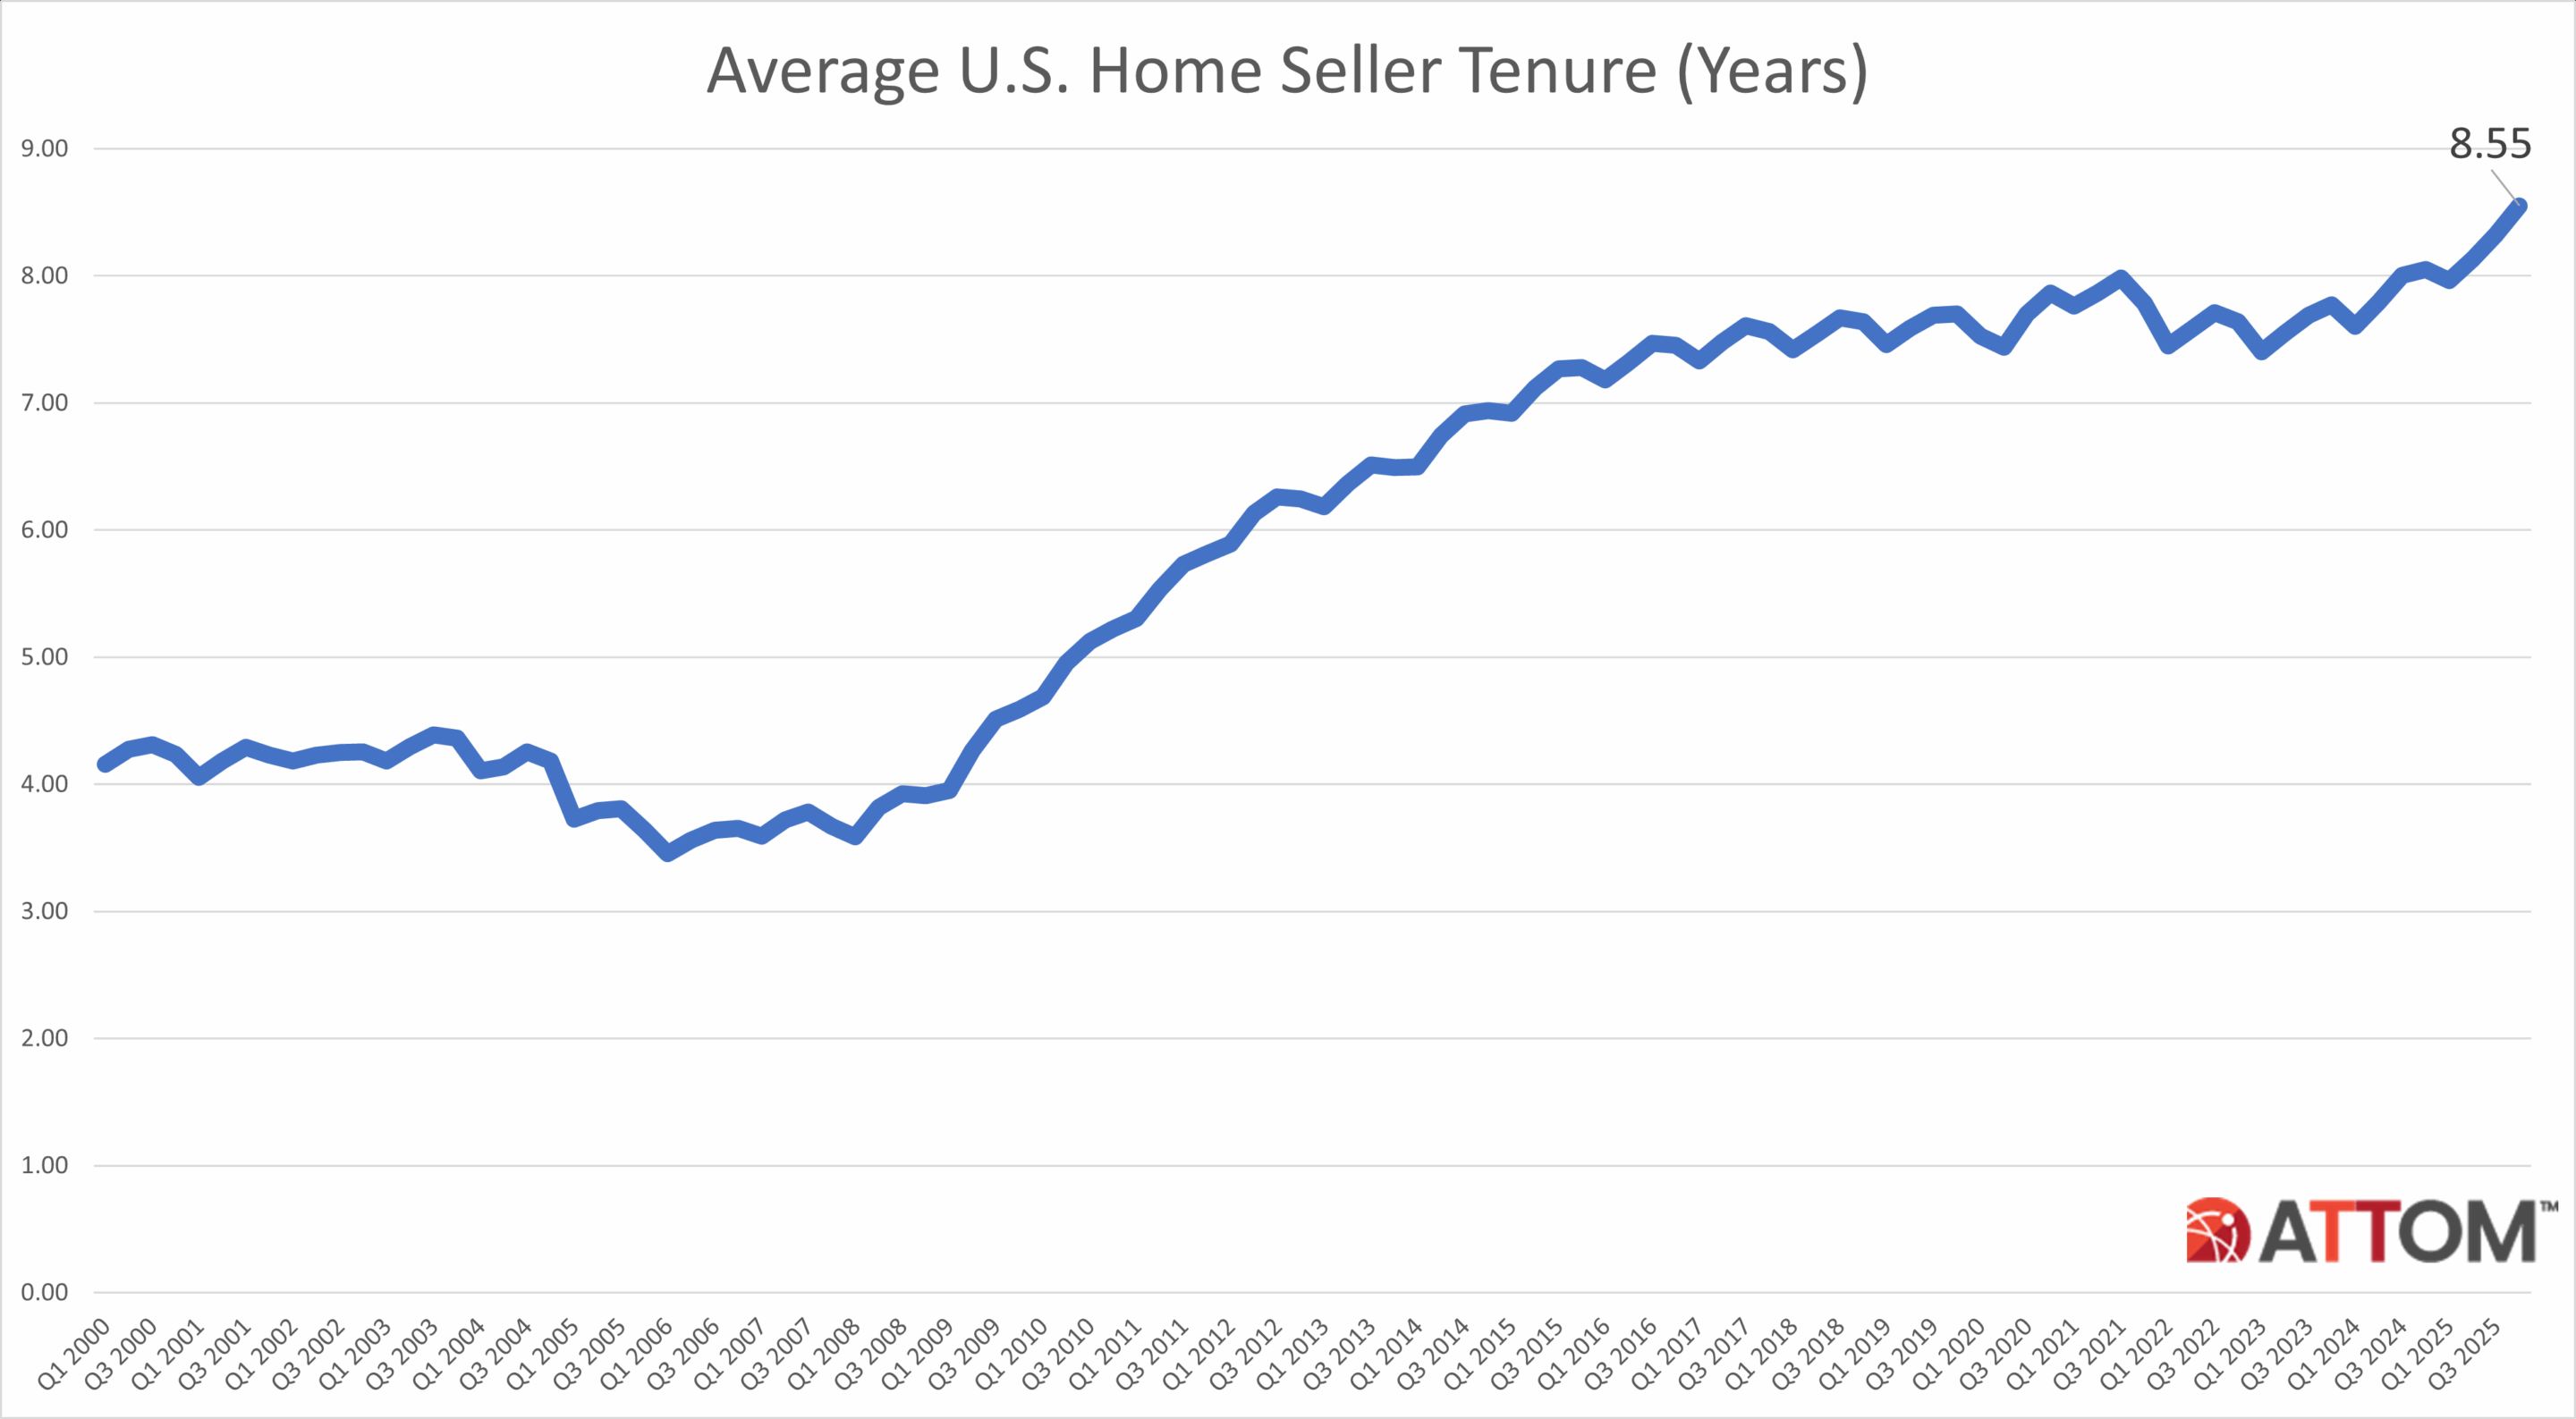
Record long home ownership tenures
Homeowners who sold their properties in the fourth quarter of 2025 had owned their homes for an average of 8.55 years, up from 8.33 years in the previous quarter and from 8.05 years at the same time last year.
The metro areas with the longest homeowner tenure prior to sale in the fourth quarter of 2025 were Barnstable, MA (14.12 years); Springfield, MA (13.49 years); New Haven, CT (13.37 years); Bridgeport, CT (13.2 years); and Hartford, CT (13.15 years).
The largest year-over-year increase in home tenure prior to sale came in Merced, CA (up 34 percent to 12.5 years); Lakeland, FL (up 18 percent to 8.26 years); Chattanooga, TN (up 17 percent to 7.98 years); Colorado Springs, CO (up 16 percent to 8.43 years); and Cape Coral, FL (up 15 percent to 8.33 years).
All-cash deals remain popular
Mortgage rates dropped steadily throughout 2025, but the share of homes purchased with all cash continued to climb to 39.1 percent, the highest it has been since 2013, albeit only a slight increase over the 39 percent share posted in 2024.
Among the metro areas with populations over 200,000 and sufficient cash sales data to be included in the analysis, the markets with the highest share of all-cash sales were Naples, FL (61.9 percent of all sales); Montgomery, AL (59.9 percent); Hilo, HI (58.8 percent); Myrtle Beach, SC (57.4 percent); and Macon, GA (56.3 percent).
Rate of lender-owned foreclosure sales down marginally
Sales of foreclosed homes to lenders accounted for 1.3 percent of all sales in 2025, down slightly from 1.4 percent the previous year.
The states with the highest rates of lender-purchased (REO) foreclosure sales were Louisiana (3.9 percent of all sales); Hawaii (3.4 percent of all sales); Illinois (2.7 percent of all sales); North Dakota (2.6 percent of all sales); and Mississippi (2.5 percent of all sales).
Among metro areas with populations over 200,000 and sufficient data to analyze, those with the largest share of REO sales were Lake Charles, LA (6.5 percent); Binghamton, NY (5.3 percent); Macon, GA (4.5 percent); and Shreveport, LA (4.1 percent); and Houma, LA (4 percent).
The smallest rates of REO sales were in Raleigh, NC (0.3 percent); Myrtle Beach, SC (0.4 percent); Denver, CO (0.4 percent); Boston, MA (0.4 percent); and San Diego, CA (0.4 percent).
More buyers using federal loan assistance
About 8.7 percent of all home sales in 2025 involved purchasers using Federal Housing Administration (FHA) loans, up from 8.4 percent in 2024.
Among metro areas with populations over 200,000 and sufficient data to analyze, the highest rates of sales to FHA-assisted buyers were in Merced, CA (25.6 percent); Visalia, CA (24.5 percent); Bakersfield, CA (22.7 percent); Modesto, CA (20.6 percent); and Lakeland, FL (20.3 percent).
Key Takeaways from the Year-End 2025 U.S. Home Sales Report
According to the ATTOM Year-End 2025 U.S. Home Sales Report home prices hit record highs in 2025, with the national median sale price rising to $360,000 as affordability pressures intensified, even while total home sales held to 3.9 million. Institutional investors continued to account for 6.6 percent of purchases. Profit margins declined with returns falling to 49 percent. Despite easing mortgage rates, elevated prices, longer ownership tenures, and a high share of all-cash deals underscored ongoing challenges for would-be buyers.
Report methodology
The ATTOM U.S. Home Sales Report provides percentages of distressed sales and all sales that are sold to investors, institutional investors and cash buyers in states and metropolitan statistical areas. Data is also available at the county and zip code level upon request. The data is derived from recorded sales deeds, foreclosure filings and loan data. Statistics for previous quarters are revised when each new report is issued as more deed data becomes available.
Definitions
All-cash purchase: sale where no loan is recorded at the time of sale and where ATTOM has coverage of loan data.
Homeownership tenure: for a given market and given quarter, the average time between the most recent sale date and the previous sale date, expressed in years.
Home seller price gains: the difference between the median sales price of homes in a given market in a given quarter and the median sales price of the previous sale of those same homes, expressed both in a dollar amount and as a percentage of the previous median sales price.
Institutional investor purchases: residential property sales to non-lending entities that purchased at least 10 properties in a calendar year.
REO sale: a sale of a property that occurs while the property is actively bank owned (REO).
About ATTOM
ATTOM powers innovation across industries with premium property data and analytics covering 158 million U.S. properties—99% of the population. Our multi-sourced real estate data includes property tax, deed, mortgage, foreclosure, environmental risk, natural hazard, neighborhood and geospatial boundary information, all validated through a rigorous 20-step process and linked by a unique ATTOM ID.
From flexible delivery solutions—such as Property Data APIs, Bulk File Licenses, Cloud Delivery, Real Estate Market Trends—to AI-Ready datasets, ATTOM fuels smarter decision-making across industries including real estate, mortgage, insurance, government, and more.
Media Contact:
Megan Hunt
megan.hunt@attomdata.com
Data and Report Licensing:
datareports@attomdata.com