New study shows home sellers see 12.8 percent premium in May; Annual analysis also looks at best months and days to sell a home
IRVINE, CA – May 3, 2023 — ATTOM, a leading curator of land, property, and real estate data, today released its annual analysis of the best days of the year to sell a home, which shows that based on home sales over the past 12 years, the months of May, June and April offer seller premiums of 10 percent or more above market value – with the top 16 best days to sell in the month of May alone.
A recent analysis of over 51 million single-family home and condo sales from 2011 to 2022 suggests that waiting for the weather to warm up before selling a property can result in higher seller premiums. The data indicates that the spring and summer months are the most active for home buying, making it an ideal time for sellers to list their homes if they are considering selling soon. Therefore, now may be the perfect time to put your home on the market.
Best Months to Sell
The analysis also took a more high-level look and showcased how seller premiums faired throughout the year and broke it out by month.
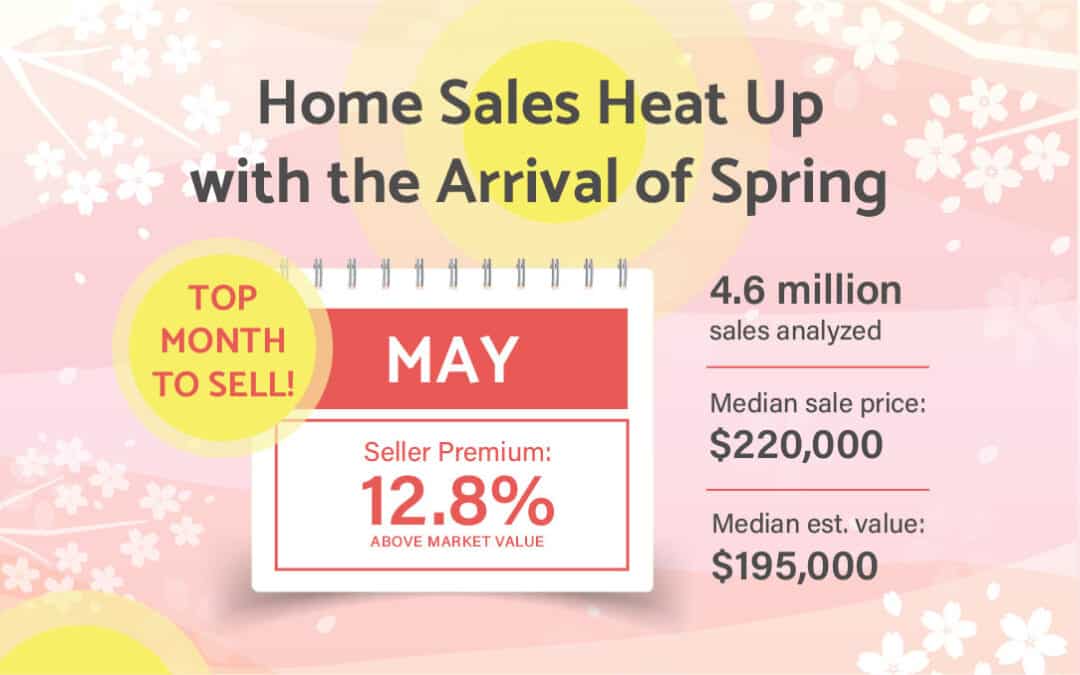
The months realizing the greatest seller premiums were as follows: May (12.8 percent); June (10.7 percent); April (10.3 percent); March (9.7 percent); July (9.6 percent); February (8.7 percent); August (8.2 percent); September (8.0 percent); January (7.5 percent); October (6.8 percent); December (6.8 percent), and November (6.3 percent).
| 2011 to 2022 Sales of Single-Family Homes and Condos | ||||
| Month | Number of Sales | Median Sales Price | Median AVM | Seller Premium |
| May | 4,682,670 | $220,000 | $195,000 | 12.8% |
| June | 5,113,824 | $228,000 | $206,000 | 10.7% |
| April | 4,284,781 | $215,000 | $195,000 | 10.3% |
| March | 4,165,429 | $210,000 | $191,357 | 9.7% |
| July | 4,962,719 | $227,500 | $207,537 | 9.6% |
| February | 3,155,773 | $200,000 | $184,000 | 8.7% |
| August | 5,042,945 | $225,000 | $208,000 | 8.2% |
| September | 4,489,812 | $223,504 | $207,000 | 8.0% |
| January | 3,268,178 | $200,000 | $186,000 | 7.5% |
| October | 4,477,405 | $220,000 | $206,000 | 6.8% |
| December | 4,085,980 | $220,000 | $206,000 | 6.8% |
| November | 3,894,634 | $220,000 | $207,000 | 6.3% |
Methodology
For this analysis ATTOM looked at any calendar days in the last 12 years (2011 to 2022) with at least 11,000 single family home and condo sales. There were 362 days that matched this criteria, with the four exceptions being Jan. 1, July 4, Nov. 11 and Dec. 25. To calculate the premium or discount paid on a given day, ATTOM compared the median sales price for homes with a purchase closing on that day with the median automated valuation model (AVM) for those same homes at the time of sale.
About ATTOM
ATTOM powers innovation across industries with premium property data and analytics covering 158 million U.S. properties—99% of the population. Our multi-sourced real estate data includes property tax, deed, mortgage, foreclosure, environmental risk, natural hazard, neighborhood and geospatial boundary information, all validated through a rigorous 20-step process and linked by a unique ATTOM ID.
From flexible delivery solutions—such as Property Data APIs, Bulk File Licenses, Cloud Delivery, Real Estate Market Trends—to AI-Ready datasets, ATTOM fuels smarter decision-making across industries including real estate, mortgage, insurance, government, and more.
Media Contact:
Christine Stricker
949.748.8428
christine.stricker@attomdata.com
Data and Report Licensing:
949.502.8313


