
Foreclosure Starts See Annual Increase of 16 Percent; Bank Repossessions Up 33 Percent from Previous Year
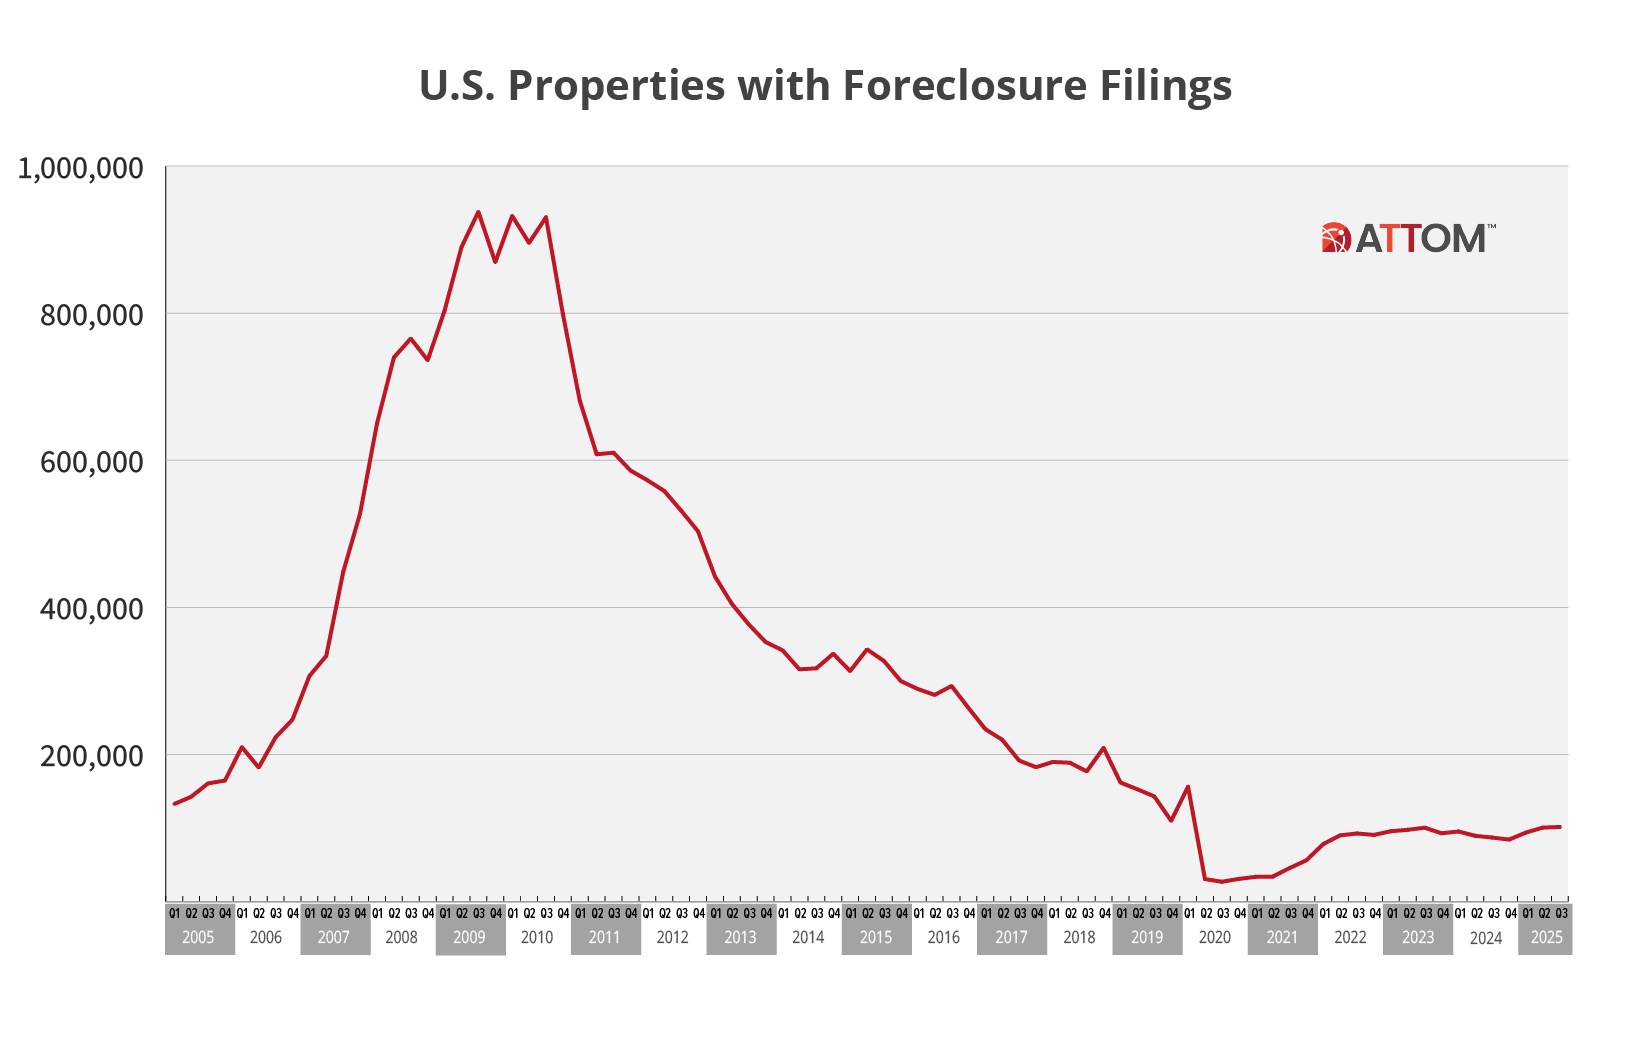
IRVINE, Calif. — October 9, 2025 — ATTOM, a leading curator of land, property, and real estate data, today released its Q3 2025 U.S. Foreclosure Market Report, which shows a total of 101,513 U.S. properties with a foreclosure filings during the third quarter of 2025, up less than 1 percent from the previous quarter and up 17 percent from a year ago.
The report also shows a total of 35,602 U.S. properties with foreclosure filings in September 2025, down 0.3 percent from the previous month and up 20 percent from a year ago.
“In 2025, we’ve seen a consistent pattern of foreclosure activity trending higher, with both starts and completions posting year-over-year increases for consecutive quarters,” said Rob Barber, CEO at ATTOM. “While these figures remain within a historically reasonable range, the persistence of this trend could be an early indicator of emerging borrower strain in some areas.”
Foreclosure starts increase nationwide
A total of 72,317 U.S. properties started the foreclosure process in Q3 2025, up 2 percent from the previous quarter and up 16 percent from a year ago.
States that had the greatest number of foreclosure starts in third quarter of 2025 included: Texas (9,736 foreclosure starts); Florida (8,909 foreclosure starts); California (7,862 foreclosure starts); Illinois (3,515 foreclosure starts); and New York (3,234 foreclosure starts).
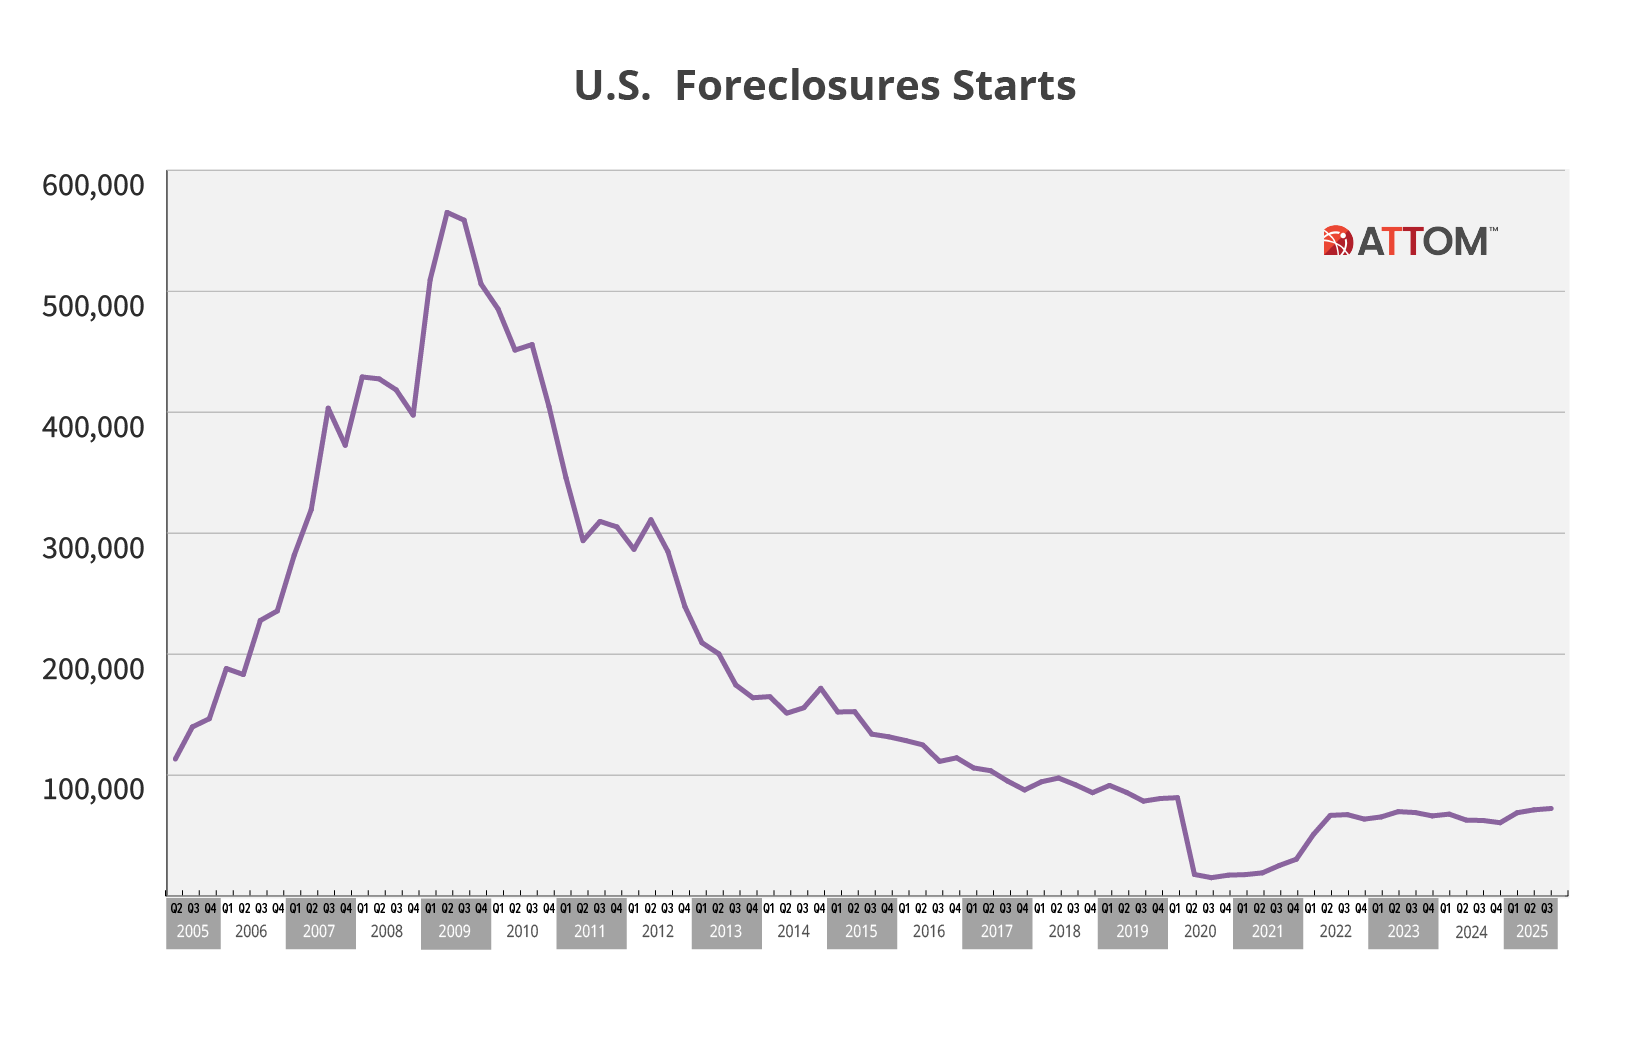
Those major metros with a population of 200,000 or more that had the greatest number of foreclosures starts in Q3 2025 included Houston, Texas (3,763 foreclosure starts); New York, New York (3,452 foreclosure starts); Chicago, Illinois (3,144 foreclosure starts); Miami, Florida (2,502 foreclosure starts); and Los Angeles, California (2,321 foreclosure starts).
Worst foreclosure rates in Florida, Nevada, and South Carolina
Nationwide one in every 1,402 housing units had a foreclosure filing in Q3 2025. States with the worst foreclosure rates were Florida (one in every 814 housing units with a foreclosure filing); Nevada (one in every 831 housing units); South Carolina (one in every 867 housing units); Illinois (one in every 944 housing units); and Delaware (one in every 974 housing units).
Among 225 metropolitan statistical areas with a population of at least 200,000, those with the worst foreclosure rates in Q3 2025 were Lakeland, Florida (one in every 470 housing units); Columbia, South Carolina (one in 506); Cape Coral, Florida (one in 589); Cleveland, Ohio (one in 593); and Ocala, Florida (one in 665).
Other major metros with a population of at least 1 million, including Cleveland at No. 4, and foreclosure rates in the top 20 worst nationwide, included Jacksonville, Florida at No.6; Las Vegas, Nevada at No.9; Houston, Texas at No. 14; and Orlando, Florida at No. 17.
Bank repossessions increase 33 percent from year ago
Lenders repossessed 11,723 U.S. properties through foreclosure (REO) in Q3 2025, up 4 percent from the previous quarter and up 33 percent from a year ago.
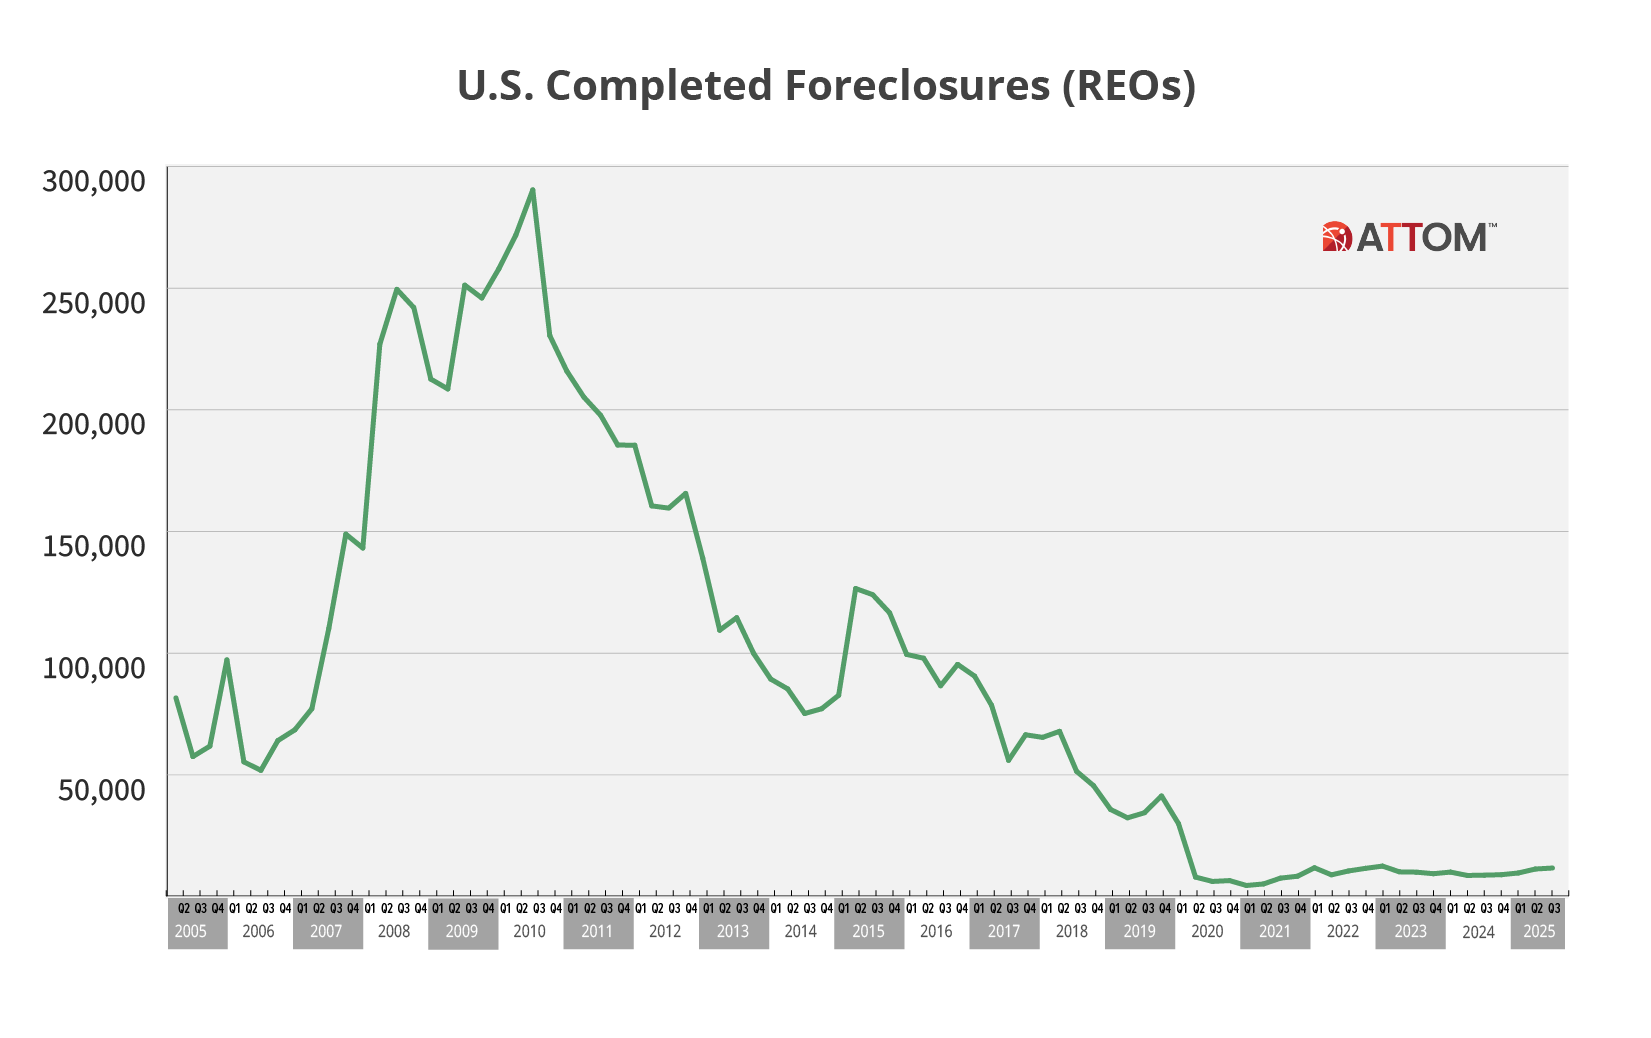
Those states that had the greatest number of REOs in Q3 2025 were Texas (1,288 REOs); California (1,132 REOs); Florida (762 REOs); Pennsylvania (708 REOs); and New York (644 REOs).
Average time to foreclose decreases 25 percent from last year
Properties foreclosed in Q3 2025 had been in the foreclosure process for an average of 608 days. This represents a 6 percent decrease from the previous quarter and a 25 percent decrease from the same time last year, continuing a downward trajectory observed since mid-2020.
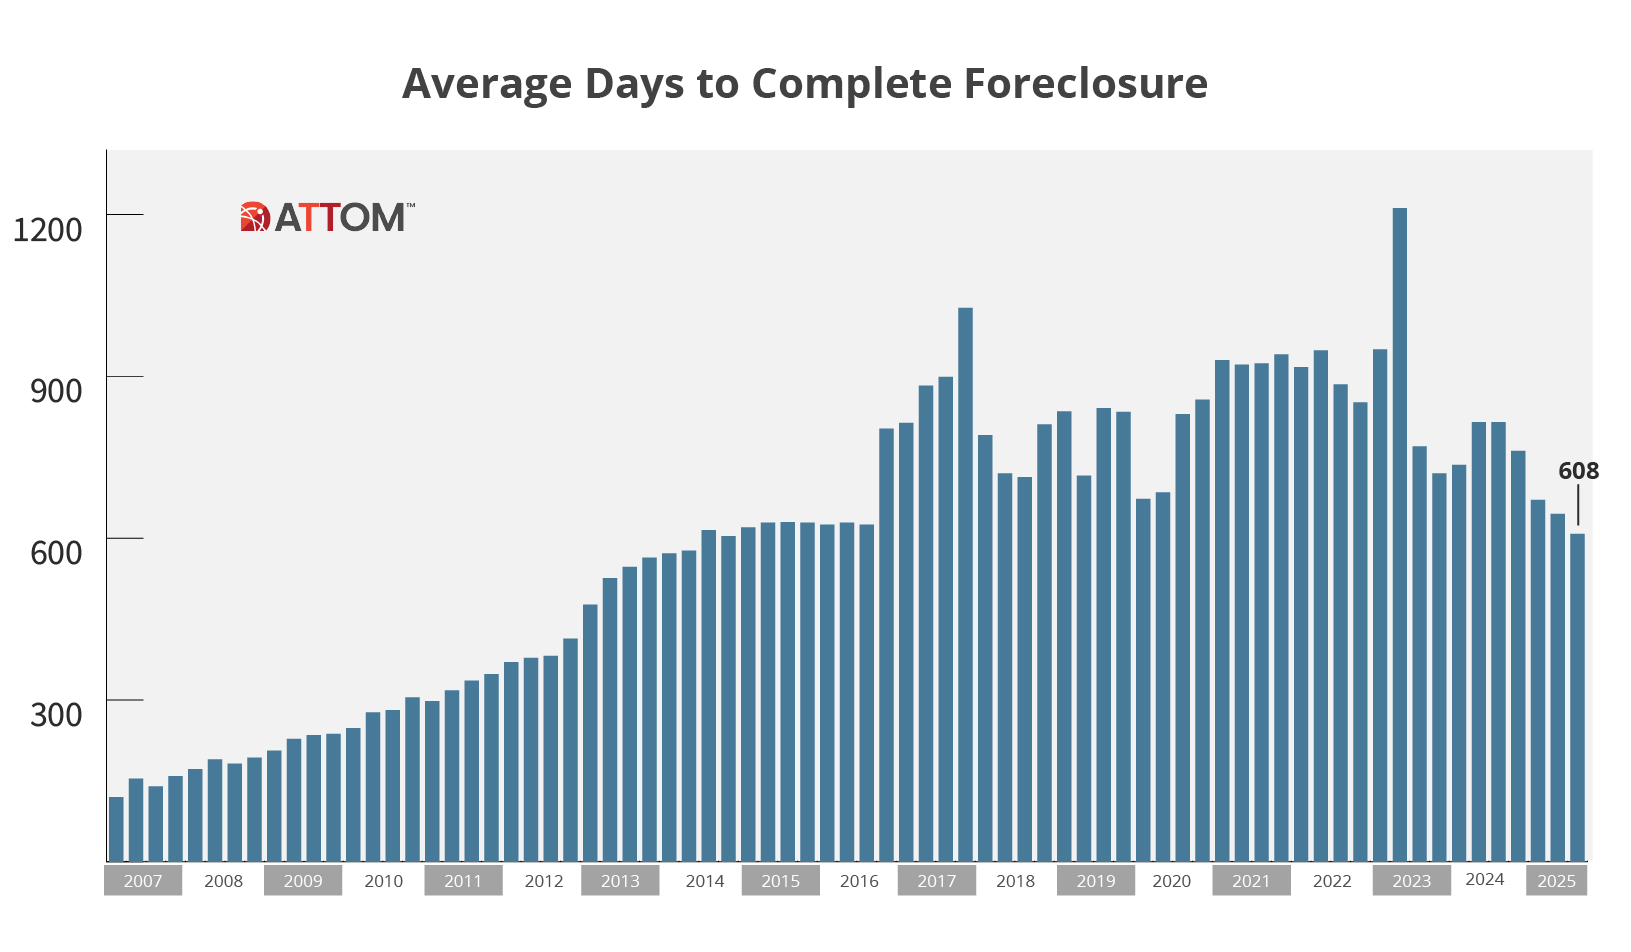
States with the longest average foreclosure timelines for homes foreclosed in Q3 2025 were Louisiana (3,632 days); Nevada (2,667 days); Rhode Island (1,929 days); New York (1,867 days); and Hawaii (1,710 days).
States with the shortest average foreclosure timelines for homes foreclosed in Q3 2025 were West Virginia (135 days); Texas (154 days); Virginia (160 days); Wyoming (165 days); and Montana (174 days).

September 2025 Foreclosure Activity High-Level Takeaways
- Nationwide in September 2025, one in every 3,997 properties had a foreclosure filing.
- States with the highest foreclosure rates in September 2025 were Florida (one in every 2,182 housing units with a foreclosure filing); Delaware (one in every 2,325 housing units); Nevada (one in every 2,417 housing units); Indiana (one in every 2,697 housing units); and South Carolina (one in every 2,883 housing units).
- 23,761 U.S. properties started the foreclosure process in September 2025, down 2 percent from the previous month and up 20 percent from September 2024.
- Lenders completed the foreclosure process on 3,780 U.S. properties in September 2025, down 7 percent from the previous month and up 44 percent from September 2024.
U.S. Foreclosure Market Data by State – Q3 2025
| Rate Rank | State Name | Total Properties with Filings | 1/every X HU (Foreclosure Rate) | %∆ Q2 2025 | %∆ Q3 2024 |
| U.S. Total | 101,513 | 1,402 | 0.82 | 16.54 | |
| 20 | Alabama | 1,442 | 1,606 | -16.21 | 8.75 |
| 19 | Alaska | 208 | 1,533 | -1.42 | 188.89 |
| 16 | Arizona | 2,155 | 1,458 | -1.42 | 27.14 |
| 37 | Arkansas | 528 | 2,619 | -18.14 | -2.40 |
| 12 | California | 11,207 | 1,297 | 4.67 | 7.26 |
| 22 | Colorado | 1,561 | 1,630 | 13.12 | 50.82 |
| 14 | Connecticut | 1,106 | 1,384 | -15.96 | -8.06 |
| 5 | Delaware | 470 | 974 | -6.00 | 10.33 |
| District of Columbia | 330 | 1,079 | 19.13 | 17.44 | |
| 1 | Florida | 12,393 | 814 | 8.25 | 21.31 |
| 15 | Georgia | 3,125 | 1,435 | 1.30 | 39.01 |
| 32 | Hawaii | 250 | 2,260 | -20.63 | 6.84 |
| 34 | Idaho | 320 | 2,427 | -12.09 | 19.85 |
| 4 | Illinois | 5,764 | 944 | -7.09 | -4.03 |
| 6 | Indiana | 2,915 | 1,013 | 10.58 | 14.72 |
| 11 | Iowa | 1,163 | 1,227 | -2.27 | 51.04 |
| 46 | Kansas | 336 | 3,825 | 15.07 | 31.76 |
| 36 | Kentucky | 783 | 2,568 | -3.45 | 5.38 |
| 17 | Louisiana | 1,429 | 1,465 | -8.34 | 15.99 |
| 24 | Maine | 417 | 1,790 | 3.47 | 39.93 |
| 7 | Maryland | 2,407 | 1,058 | 29.69 | 7.65 |
| 30 | Massachusetts | 1,426 | 2,114 | -2.93 | -5.81 |
| 25 | Michigan | 2,518 | 1,827 | -20.14 | -0.16 |
| 31 | Minnesota | 1,116 | 2,258 | -7.00 | 25.11 |
| 45 | Mississippi | 368 | 3,622 | 3.66 | 14.29 |
| 35 | Missouri | 1,148 | 2,447 | 1.23 | 61.24 |
| 48 | Montana | 102 | 5,127 | 12.09 | 121.74 |
| 44 | Nebraska | 243 | 3,521 | -3.19 | 31.35 |
| 2 | Nevada | 1,574 | 831 | 18.70 | 12.67 |
| 43 | New Hampshire | 209 | 3,083 | -2.34 | 36.60 |
| 9 | New Jersey | 3,495 | 1,080 | 6.55 | 0.26 |
| 27 | New Mexico | 468 | 2,029 | -14.75 | 40.96 |
| 21 | New York | 5,269 | 1,621 | -2.71 | -1.22 |
| 18 | North Carolina | 3,200 | 1,505 | -2.91 | 40.78 |
| 42 | North Dakota | 123 | 3,048 | -4.65 | 19.42 |
| 8 | Ohio | 4,959 | 1,063 | 6.71 | 17.29 |
| 26 | Oklahoma | 944 | 1,868 | -15.79 | 11.98 |
| 39 | Oregon | 668 | 2,752 | -9.97 | 24.86 |
| 23 | Pennsylvania | 3,269 | 1,768 | -10.68 | -5.71 |
| 40 | Rhode Island | 174 | 2,785 | -11.68 | -14.71 |
| 3 | South Carolina | 2,769 | 867 | 0.80 | 25.35 |
| 50 | South Dakota | 33 | 12,088 | 13.79 | -5.71 |
| 38 | Tennessee | 1,154 | 2,682 | -14.01 | 3.96 |
| 10 | Texas | 10,584 | 1,123 | 8.21 | 63.23 |
| 13 | Utah | 908 | 1,314 | -0.87 | -13.52 |
| 49 | Vermont | 50 | 6,741 | -18.03 | 19.05 |
| 28 | Virginia | 1,774 | 2,060 | 0.74 | 21.59 |
| 33 | Washington | 1,397 | 2,335 | 2.80 | 35.76 |
| 47 | West Virginia | 217 | 3,962 | -16.54 | 100.93 |
| 41 | Wisconsin | 914 | 3,010 | -4.59 | 4.10 |
| 29 | Wyoming | 131 | 2,100 | -3.68 | 57.83 |
Table summary
Despite some states recording quarterly declines, the broader trend suggests that foreclosure activity remains elevated compared to last year.
Report conclusion
Foreclosure activity continued its gradual upward trend in Q3 2025, with both starts and completions posting annual increases. While overall levels remain relatively low by historical standards, the consistency of these gains over consecutive quarters highlights a market that may be slowly shifting amid broader economic pressures.
Report methodology
The ATTOM U.S. Foreclosure Market Report provides a count of the total number of properties with at least one foreclosure filing entered into the ATTOM Data Warehouse during the month and quarter. Some foreclosure filings entered into the database during the quarter may have been recorded in the previous quarter. Data is collected from more than 3,000 counties nationwide, and those counties account for more than 99 percent of the U.S. population. ATTOM’s report incorporates documents filed in all three phases of foreclosure: Default — Notice of Default (NOD) and Lis Pendens (LIS); Auction — Notice of Trustee Sale and Notice of Foreclosure Sale (NTS and NFS); and Real Estate Owned, or REO properties (that have been foreclosed on and repurchased by a bank). For the annual, midyear and quarterly reports, if more than one type of foreclosure document is received for a property during the timeframe, only the most recent filing is counted in the report. The annual, midyear, quarterly and monthly reports all check if the same type of document was filed against a property previously. If so, and if that previous filing occurred within the estimated foreclosure timeframe for the state where the property is located, the report does not count the property in the current year, quarter or month.
About ATTOM
ATTOM powers innovation across industries with premium property data and analytics covering 158 million U.S. properties—99% of the population. Our multi-sourced real estate data includes property tax, deed, mortgage, foreclosure, environmental risk, natural hazard, neighborhood and geospatial boundary information, all validated through a rigorous 20-step process and linked by a unique ATTOM ID.
From flexible delivery solutions—such as Property Data APIs, Bulk File Licenses, Cloud Delivery, Real Estate Market Trends—to AI-Ready datasets, ATTOM fuels smarter decision-making across industries including real estate, mortgage, insurance, government, and more.
Media Contact:
Megan Hunt
megan.hunt@attomdata.com
Data and Report Licensing:
datareports@attomdata.com