Average Time to Foreclose Drops to Two-Year Low;
Foreclosure Starts Up From Year Ago in 36 Percent of Local Markets;
FHA Foreclosure Rates for 2014 and 2015 Vintages Above Long-Term Average
IRVINE, Calif. – Oct. 11, 2018 — ATTOM Data Solutions, curator of the nation’s premier property database, today released its Q3 2018 U.S. Foreclosure Market Report™, which shows a total of 177,146 U.S. properties with foreclosure filings — default notices, scheduled auctions or bank repossessions — in the third quarter, down 6 percent from the previous quarter and down 8 percent from a year ago to the lowest level since Q4 2005 — a nearly 13-year low.
U.S. foreclosure activity in Q3 2018 was 36 percent below the pre-recession average of 278,912 properties with foreclosure filings per quarter between Q1 2006 and Q3 2007 — the eighth consecutive quarter where U.S. foreclosure activity has registered below the pre-recession average.
“A decade after poorly underwritten mortgages triggered a housing market crash, it’s clear that the foreclosure risk associated with those problem mortgages has faded — average foreclosure timelines have dropped to a two-year low, and the share of foreclosures tied to 2004-to-2008 loans has dropped well below 50 percent,” said Daren Blomquist, senior vice president at ATTOM Data Solutions. “The biggest foreclosure risk in today’s housing market comes from natural disaster events such as the twin hurricanes of a year ago. Foreclosure starts spiked in the third quarter in many local markets impacted by those hurricanes. Secondarily, we are seeing relatively modest — but more widespread — foreclosure risk associated with FHA loans originated in 2014 and 2015.”

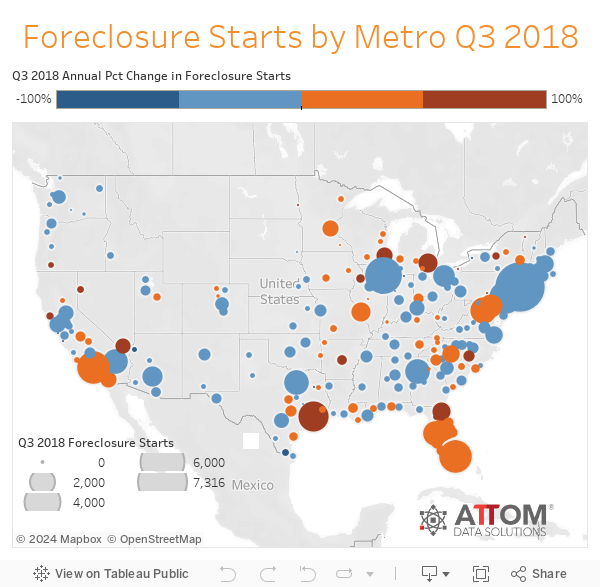
Foreclosure starts down nationwide, up in 36 percent of local markets
Lenders started the foreclosure process on 91,849 U.S. properties in Q3 2018, down 6 percent from the previous quarter and down 3 percent from a year ago — the 13th consecutive quarter with a year-over-year decrease in foreclosure starts.
Counter to the national trend, 15 states posted year-over-year increases in foreclosure starts in Q3 2018, including Florida (up 25 percent); Texas (up 3 percent); Maryland (up 13 percent); Michigan (up 32 percent); and Missouri (up 10 percent).
Also counter to the national trend, 79 of 219 metropolitan statistical areas analyzed in the report (36 percent) posted a year-over-year increase in foreclosure starts in Q3 2018, including Los Angeles, California (up 2 percent); Houston, Texas (up 51 percent); Washington, D.C. (up 2 percent); Miami, Florida (up 29 percent); and Detroit, Michigan (up 65 percent).
Other markets with at least 1 million people and a year-over-year increase of at least 15 percent in foreclosure starts in Q3 2018 were Minneapolis-St. Paul, Minnesota; Tampa-St. Petersburg, Florida; St. Louis, Missouri; Orlando, Florida; Las Vegas, Nevada; Austin, Texas, Milwaukee, Wisconsin; Jacksonville, Florida; and Grand Rapids, Wyoming.
FHA foreclosure rates for 2014 and 2015 vintages above long-term average
FHA foreclosure rates for 2014 and 2015 loan vintages registered above the long-term average foreclosure rate for FHA loans, the only two post-recession vintages (2010 and later) above the long-term average.
FHA loans originated in 2014 had the highest foreclosure rate of any post-recession loan vintage nationwide, as well as in 31 states and in 63 of 115 metropolitan statistical areas analyzed (55 percent), including New York, Chicago, Dallas-Fort Worth, Philadelphia and Houston.
FHA loans originated in 2015 had the highest foreclosure rate of any post-recession loan vintage in 10 states and in 21 of 115 metropolitan statistical areas analyzed (18 percent), including Atlanta, Miami, San Antonio, Oklahoma City and Memphis.

Highest foreclosure rates in New Jersey, Delaware, Maryland
Nationwide one in every 757 properties had a foreclosure filing in Q3 2018. States with the highest foreclosure rates in Q3 2018 were New Jersey (one in every 267 housing units with a foreclosure filing); Delaware (one in every 315); Maryland (one in every 379); Florida (one in every 449); and Nevada (one in every 472).
Among 219 metropolitan statistical areas analyzed in the report, those with the highest foreclosure rates in Q3 2018 were Atlantic City, New Jersey (one in every 152 housing units with a foreclosure filing); Trenton, New Jersey (one in every 236); Fayetteville, North Carolina (one in every 253); Peoria, Illinois (one in every 299); and Philadelphia, Pennsylvania (one in every 326).
Bank repossessions drop to record low nationwide, up in 17 states
Lenders repossessed 51,459 U.S. properties through foreclosure (REO) in Q3 2018, down 24 percent from the previous quarter and down 8 percent from a year ago to the lowest level since ATTOM began tracking in Q2 2005.
Counter to the national trend, the District of Columbia and 17 states posted year-over-year increases in REO activity in Q3 2018, including New Jersey (up 4 percent); Texas (up 21 percent); New York (up 3 percent); Georgia (up 56 percent); and Missouri (up 27 percent).
Average time to foreclose drops to two-year low
Properties foreclosed in Q3 2018 had been in the foreclosure process an average of 713 days, down from 720 days in the previous quarter and down from 899 days in Q3 2017 to the lowest level since Q2 2016 — a two-year low.
States with the longest average foreclosure timelines for homes foreclosed in Q3 2018 were Hawaii (1,491 days); Indiana (1,295 days); Florida (1,177 days); Utah (1,170 days); New Jersey (1,137 days); and New York (1,092 days).
States with the shortest average foreclosure timelines for homes foreclosed in Q3 2018 were Virginia (179 days); Mississippi (209 days); New Hampshire (216 days); Alaska (237 days); and Nebraska (240 days).

Report methodology
The ATTOM Data Solutions U.S. Foreclosure Market Report provides a count of the total number of properties with at least one foreclosure filing entered into the ATTOM Data Warehouse during the month and quarter. Some foreclosure filings entered into the database during the quarter may have been recorded in a previous quarter. Data is collected from more than 2,200 counties nationwide, and those counties account for more than 90 percent of the U.S. population. ATTOM’s report incorporates documents filed in all three phases of foreclosure: Default — Notice of Default (NOD) and Lis Pendens (LIS); Auction — Notice of Trustee Sale and Notice of Foreclosure Sale (NTS and NFS); and Real Estate Owned, or REO properties (that have been foreclosed on and repurchased by a bank). For the annual, midyear and quarterly reports, if more than one type of foreclosure document is received for a property during the timeframe, only the most recent filing is counted in the report. The annual, midyear, quarterly and monthly reports all check if the same type of document was filed against a property previously. If so, and if that previous filing occurred within the estimated foreclosure timeframe for the state where the property is located, the report does not count the property in the current year, quarter or month.
About ATTOM Data Solutions
ATTOM Data Solutions provides premium property data to power products that improve transparency, innovation, efficiency and disruption in a data-driven economy. ATTOM multi-sources property tax, deed, mortgage, foreclosure, environmental risk, natural hazard, and neighborhood data for more than 155 million U.S. residential and commercial properties covering 99 percent of the nation’s population. A rigorous data management process involving more than 20 steps validates, standardizes and enhances the data collected by ATTOM, assigning each property record with a persistent, unique ID — the ATTOM ID. The 9TB ATTOM Data Warehouse fuels innovation in many industries including mortgage, real estate, insurance, marketing, government and more through flexible data delivery solutions that include bulk file licenses, APIs, market trends, marketing lists, match & append and more.
Media Contact:
Christine Stricker
949.748.8428
christine.stricker@attomdata.com
Data and Report Licensing:
949.502.8313
datareports@attomdata.com