
Home Flipping Rate Down From Previous Quarter and a Year Ago;
Share of Financed Flips Down from Nearly 10-Year High a Year Ago;
32 Percent of Flips Acquired Via Distressed Sale, Down From 68 Percent Peak in Q1 2010
IRVINE, Calif. – Sept. 6, 2018 — ATTOM Data Solutions, curator of the nation’s premier property database, today released its Q2 2018 U.S. Home Flipping Report, which shows that homes flipped in the second quarter of 2018 yielded an average gross return on investment of 44.3 percent, down from 47.8 percent in the previous quarter and down from 50.0 percent in Q2 2017 to the lowest average gross flipping ROI since Q3 2014.

The report shows a total of 48,768 U.S. single family homes and condos were flipped in the second quarter of 2018, a home flipping rate of 5.2 percent of all sales — down from a 6.6 percent home flipping rate in Q1 2018 and down from a 5.4 percent home flipping rate in Q2 2017.
Homes flipped in Q2 2018 sold for an average of $65,520 more than what the home flipper purchased them for, down from an all-time high average gross flipping profit of $69,500 in the first quarter and down from an average gross flipping profit of $69,000 a year ago. The average gross flipping profit in the second quarter was the lowest since Q2 2016 — a two-year low.
“Fewer distressed sales are limiting the ability of home flippers to find deep discounts even while rising interest rates are shrinking the pool of potential buyers for flipped homes,” said Daren Blomquist, senior vice president at ATTOM Data Solutions. “These two forces are squeezing average home flipping returns, pushing investors to leverage financing or migrate to markets with more distressed discounts available to achieve more favorable returns.”
32 percent of home flips purchased via distressed sale, down from peak of 68 percent
Of homes flipped in Q2 2018, 32.3 percent were purchased by the home flipper via a distressed sale – either in foreclosure or bank-owned, down from 35.8 percent the previous quarter and down from 38.7 percent a year ago. The peak in distressed sales purchases by home flippers was 68.2 percent in Q1 2010.
States with the highest share of Q2 2018 home flips purchased via a distressed sale were New Jersey (64.1 percent); Delaware (60.3 percent); Indiana (55.4 percent); Maryland (52.8 percent); and New York (48.4 percent).
“The business of adding some superficial cosmetic upgrades to a distressed purchase and then selling for a profit is no longer an option,” said Jeff Pintar, founding partner and CEO at Pintar Investment Company, which flips homes in California, Nevada and Georgia. “Home buyers are expecting quality product throughout the entire property parcel. Buyers have plenty of choices and only the top-quality homes are selling. This means investors need to fine tune their operations and pricing models and deliver model-like homes in order to compete. In our markets, we see home buyers continuing to be willing to pay more for better quality — this is first time and move up buyers.”
Among 140 metropolitan statistical areas with at least 50 flips in Q2 2018 and a population of at least 200,000, those with the highest share of Q2 2018 home flips purchased via distressed sale were Atlantic City, New Jersey (71.0 percent); El Paso, Texas (70.5 percent); Trenton, New Jersey (65.2 percent); Virginia Beach, Virginia (60.7 percent); and New York, New York (56.5 percent).
39 percent of home flips purchased with financing
Among home flips completed in Q2 2018, 38.6 percent were purchased by the home flipper with financing, up from 36.8 percent in the previous quarter but down from a nearly 10-year high of 39.6 percent in Q2 2017.
“Acquisition prices have been creeping up, and it’s now more difficult for investors to buy with cash than previously, but high prices are not the only reason flippers are turning to financing,” said Robert Greenberg, chief marketing officer with Patch of Land, a peer-to-peer lending marketplace for real estate investors. “We see many borrowers coming to us simply for the ability to make more money. Financing can be the answer to making more profit overall: an investor that nets $30,000 per flip after paying $5,000 to $10,000 for financing costs can make $90,000 on three flips with the same amount of cash required to make $40,000 on a single flip. For some experienced investors, it’s possible to do 20 to 30 flips per year with financing versus 10 or less using all cash.”
States with the highest share of flips purchased with financing were Rhode Island (63.8 percent); Colorado (57.1 percent); New Hampshire (53.4 percent); Minnesota (50.2 percent); and Washington 50.0 percent).
Among 140 metropolitan statistical areas with at least 50 flips in Q2 2018 and a population of at least 200,000, those with the highest share of flips purchased with financing were Fort Collins, Colorado (66.7 percent); Colorado Springs, Colorado (66.0 percent); Providence, Rhode Island (60.3 percent); Greeley, Colorado (59.6 percent); and Seattle, Washington (54.6 percent).
“It has gotten tougher and tougher to flip homes in the Colorado market. Not only is the competition fierce, but home prices continue to rise,” said Mark Ferguson, a real estate broker, investor and founder of InvestFourMore. “I flip from 10 to 20 houses at one time, and even though I use financing it takes more money to flip when prices are higher. I have thought about moving to a cheaper market, but I love Colorado and I am doing everything I can to make it work here. I used to pay from $50,000 to $100,000 for most of my house flips, and now I am paying $150,000 to $250,000 for my flips with not much more profit. My average profit in the past after all expenses has been around $32,000, and this year it is closer to $40,000.”
Among 1,451 U.S. zip codes analyzed in the report with at least 10 flips during the quarter, those with the highest share of flips purchased with financing were 80923 in Colorado Springs, Colorado (85.7 percent); 85006 in Phoenix, Arizona (84.6 percent); 98033 in Kirkland, Washington in the Seattle metro area (84.6 percent); 80525 in Fort Collins, Colorado (84.2 percent); and 20002 in the District of Columbia (81.8 percent).

Highest gross flipping returns in Louisiana, Pennsylvania, Ohio
States with the highest average gross flipping ROI in Q2 2018 were Louisiana (102.5 percent), Pennsylvania (100.3 percent), Ohio (81.4 percent), Maryland (76.1 percent), and Tennessee (74.9 percent).
“Flipping in the Rust Belt continues to provide solid returns and continues to be a viable investment strategy. But the investor must provide a great product, new mechanicals, new kitchens and baths with today’s modern open concepts and bright light finishes — when they do these house sell fast,” said Josh Cantwell, CEO at Strategic Real Estate Coach and fix-and-flip lender Freeland Ventures. “The key now is finding great deals. But since we’re in the Rust Belt there’s plenty of off-market sellers with aged properties and deferred maintenance looking to sell below market value. Investors have to be better marketers now more than ever to beat their competition to those deals.”
Among 140 metropolitan statistical areas with at least 50 flips in Q2 2018 and a population of at least 200,000, those with the highest average gross flipping ROI in Q2 2018 were Pittsburgh, Pennsylvania (162.7 percent); Hickory-Lenoir-Morganton, North Carolina (129.0 percent); Mobile, Alabama (126.6 percent); Buffalo, New York (107.5 percent); and Baton Rouge, Louisiana (107.1 percent).
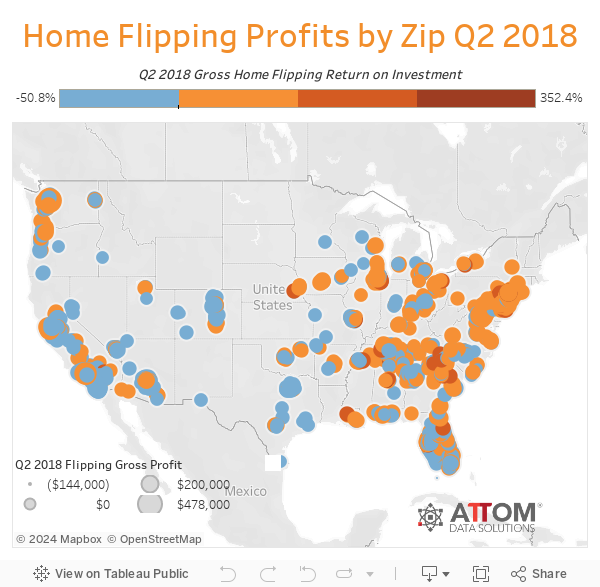
Among 1,451 U.S. zip codes analyzed in the report with at least 10 flips during the quarter, those with the highest average gross flipping ROI in Q2 2018 were 35211 in Birmingham, Alabama (352.4 percent); 63118 in St. Louis, Missouri (351.6 percent); 37344 in Fayetteville, Tennessee (323.7 percent); 19144 in Philadelphia, Pennsylvania (294.1 percent); and 07017 in East Orange, New Jersey (273.1 percent).
Highest home flipping rates in D.C., Nevada, Tennessee
The District of Columbia had the highest home flipping rate in the nation in Q2 2018 (8.3 percent), followed by Nevada (7.4 percent), Tennessee (7.2 percent), Arizona (6.7 percent), Maryland (6.5 percent), and Alabama (6.4 percent).
Among 140 metropolitan statistical areas with at least 50 flips in Q2 2018 and a population of at least 200,000, those with the highest home flipping rate for the quarter were Memphis, Tennessee (9.7 percent); Clarksville, Tennessee (8.2 percent); Atlantic City, New Jersey (7.9 percent); York, Pennsylvania (7.7 percent); and Las Vegas, Nevada (7.7 percent).
Among 1,451 U.S. zip codes analyzed in the report with at least 10 flips during the quarter, those with the highest home flipping rate were 11950 in the Long Island city of Mastic, New York (35.3 percent); 78537 in Donna, Texas, in the McAllen metro area (32.3 percent); 11717 in the Long Island city of Brentwood, New York (28.2 percent); 35214 in Birmingham, Alabama (27.4 percent); and 38109 in Memphis, Tennessee (27.2 percent).
Shortest average time to flip in New Hampshire, Arizona, Nevada, Alabama, Missouri
The average time to complete a home flip was 186 days for flips completed in Q2 2018 compared to 182 days in the previous quarter and 185 days a year ago.
States with the longest shortest average time to flip were New Hampshire (151 days); Arizona (161 days), Nevada (167 days), Alabama (168 days), and Missouri (171 days).
Among 140 metropolitan statistical areas with at least 50 flips in Q2 2018 and a population of at least 200,000, those with the shortest average time to flip were Memphis, Tennessee (137 days), Manchester-Nashua, New Hampshire (138 days), Mobile, Alabama (140 days), McAllen-Edinburg-Mission, Texas (147 days); and Vallejo-Fairfield, California (150 days).
Among 1,451 U.S. zip codes analyzed in the report (with at least 10 flips during the quarter), those with the shortest average time to flip were 73110 in Oklahoma City, Oklahoma (83 days) followed by three Atlanta-area zip codes: 30039 in Snellville, Georgia (88 days); 30294 in Ellenwood, Georgia (89 days); and 30052 in Loganville (91 days); and 93637 in Madera, California (92 days).
Other high-level report takeaways
- The median year built of homes flipped in Q2 2018 was 1978, tied for the oldest median year built as far back as data is available — Q1 2000.
- The median square footage of homes flipped in Q2 2018 was 1,408, the smallest median square footage as far back as data is available — Q1 2000.
- A total of 40,265 entities flipped properties in Q2 2018, a ratio of 1.21 flips per entity, the lowest ratio of flips per entity since Q1 2008 — a more than 10-year low.
Report methodology
ATTOM Data Solutions analyzed sales deed data for this report. A single family home or condo flip was any arms-length transaction that occurred in the quarter where a previous arms-length transaction on the same property had occurred within the last 12 months. The average gross flipping profit is the difference between the purchase price and the flipped price (not including rehab costs and other expenses incurred, which flipping veterans estimate typically run between 20 percent and 33 percent of the property’s after repair value). Gross flipping return on investment was calculated by dividing the gross flipping profit by the first sale (purchase) price.
About ATTOM Data Solutions
ATTOM Data Solutions provides premium property data to power products that improve transparency, innovation, efficiency and disruption in a data-driven economy. ATTOM multi-sources property tax, deed, mortgage, foreclosure, environmental risk, natural hazard, and neighborhood data for more than 155 million U.S. residential and commercial properties covering 99 percent of the nation’s population. A rigorous data management process involving more than 20 steps validates, standardizes and enhances the data collected by ATTOM, assigning each property record with a persistent, unique ID — the ATTOM ID. The 9TB ATTOM Data Warehouse fuels innovation in many industries including mortgage, real estate, insurance, marketing, government and more through flexible data delivery solutions that include bulk file licenses, APIs, market trends, marketing lists, match & append and more.
Media Contact:
Christine Stricker
949.748.8428
christine.stricker@attomdata.com
Data and Report Licensing:
949.502.8313
datareports@attomdata.com
