Nationwide Home-Flipping Rate Jumps to Highest Level This Century; Raw Profits on Home Flips Increase for First Time Since 2020; But Typical Profit Margins on Flips Decline Again, to Lowest Point Since 2009
IRVINE, Calif. – June 23, 2022 — ATTOM, a leading curator of real estate data nationwide for land and property data, today released its first-quarter 2022 U.S. Home Flipping Report showing that 114,706 single-family houses and condominiums in the United States were flipped in the first quarter. Those transactions represented 9.6 percent of all home sales in the first quarter of 2022, or one in 10 transactions – the highest level since at least 2000. The latest total was up from 6.9 percent, or one in every 14 home sales in the nation during the fourth quarter of 2021, and from 4.9 percent, or one in 20 sales, in the first quarter of last year.
The jump in the home-flipping rate during the first quarter of this year marked the fifth straight quarterly increase. It also represented the largest quarterly and annual percentage-point gains since 2000.
But the report also shows that as home sales by investors spiked, typical raw profits on those deals remained below where they were a year ago, and in a more striking trend, profit margins dipped to their lowest point since 2009.
“The good news for fix-and-flip investors is that demand remains strong from prospective homebuyers, as evidenced by this quarter’s report, which shows that one of every 10 homes sold during Q1 was a flip,” said Rick Sharga, executive vice president of market intelligence for ATTOM. “The bad news is that rising mortgage interest rates are beginning to slow down home price appreciation rates, and buyers have become more selective – and less willing to outbid other buyers for properties they’re interested in. This is having a predictable impact on profit margins for investors.”

Among all flips nationwide, the gross profit on typical transactions (the difference between the median purchase price paid by investors and the median resale price) stood at $67,000 in the first quarter of 2022. While that was up 5.5 percent from $63,500 in the fourth quarter of 2021, and represented the first increase since late 2020, it was 4.3 percent less than the $70,000 level recorded in the first quarter of 2021.
Profit margins, meanwhile, fell for the sixth quarter in a row, as the typical gross-flipping profit of $67,000 in the first quarter of 2022 translated into just a 25.8 percent return on investment compared to the original acquisition price. The national gross-flipping ROI was down from 27.3 percent in the fourth quarter of 2021 and from 38.9 percent a year earlier. It sat at the lowest point since the first quarter of 2009, when the housing market was slumping from the effects of the Great Recession in the late 2000s.
The latest return on investment also was less than half the peak of 53.1 percent for this century, which hit in late 2016.
Profit margins declined in the first quarter of 2022 as resale prices on flipped homes continued to shoot up more slowly than they were when investors originally bought their properties.
Specifically, the median price of homes flipped in the first quarter of 2022 increased to another all-time high of $327,000. That was up 10.5 percent from $296,000 in the fourth quarter of 2021 and 30.8 percent from $250,000 a year earlier. Both increases stood out as the largest for flipped properties since 2000.
Home flipping rates up in 95 percent of local markets
Home flips as a portion of all home sales increased from the fourth quarter of 2021 to the first quarter of 2022 in 181 of the 191 metropolitan statistical areas around the U.S. analyzed for this report (95 percent). Rates went up quarterly by at least two percentage points in 99 of those metros (52 percent). (Metro areas were included if they had a population of 200,000 or more and at least 50 home flips in the first quarter of 2022.)
Among those metros, the largest flipping rates during the first quarter of 2022 were in Phoenix, AZ (flips comprised 18.7 percent of all home sales); Charlotte, NC (18 percent); Tucson, AZ (16.2 percent); Atlanta, GA (16.1 percent) and Jacksonville, FL (16 percent).

The highest flipping rates during the first quarter of 2022 in metro areas with a population of less than 1 million were in Durham, NC (15.3 percent); Gainesville, FL (14.9 percent); Ogden, UT (13.9 percent); Clarksville, TN (13.4 percent) and Winston-Salem, NC (13.4 percent).
The smallest home-flipping rates among metro areas analyzed in the first quarter were in Olympia, WA (4.4 percent); Portland, ME (4.6 percent); Salem, OR (4.7 percent); Syracuse, NY (4.7 percent) and Davenport, IA (4.9 percent).
Typical home flipping returns decrease in three quarters of metro areas
The median $327,000 resale price of homes flipped nationwide in the first quarter of 2022 generated a gross flipping profit of $67,000 above the median investor purchase price of $260,000. That resulted in a 25.8 percent profit margin.
Profit margins dipped from the first quarter of 2021 to the first quarter of 2022 in 139 of the 191 metro areas with enough data to analyze (73 percent).
The biggest annual declines came in Salisbury, MD (ROI down from 173.7 percent in the first quarter of 2021 to 29.3 percent in the first quarter of 2022); Elkhart, IN (down from 148.3 percent to 24.9 percent); Macon, GA (down from 120.7 percent to 50.9 percent); Lynchburg, VA (down from 96.2 percent to 31.5 percent) and Flint, MI (down from 126.2 percent to 64 percent).
Markets with the largest returns on investment during the first quarter of 2022 on typical home flips were Scranton, PA (115.5 percent); Kingsport, TN (114 percent); Reading, PA (108.6 percent); Pittsburgh, PA (105.7 percent) and Johnson City, TN (101.1 percent).
Aside from Pittsburgh, the largest investment returns in the first quarter among metro areas with a population of at least 1 million were in Buffalo, NY (ROI of 88.2 percent); Philadelphia, PA (80.3 percent); Richmond, VA (79 percent) and New Orleans, LA (69.9 percent).
Metro areas with the smallest profit margins on typical home flips in the first quarter of 2022 were Boise, ID (4.4 percent return); Fort Collins, CO (5.7 percent); College Station, TX (7.2 percent); Sacramento, CA (9 percent) and Santa Rosa, CA (9.6 percent).

West and Northeast continue to boast largest raw profits; South and Midwest have smallest
The highest raw profits on median-priced home flips in the first quarter of 2022, measured in dollars, were concentrated among western and northeastern metro areas. Twelve of the top 15 were in those regions, led by San Jose, CA (typical gross profit of $420,000); San Francisco, CA ($220,000); Seattle, WA ($155,000); Bremerton, WA ($150,000); and Naples, FL ($145,000).
At the opposite end of the range, 20 of the 25 lowest raw profits on typical home flips were spread across the South and Midwest. The smallest were in Syracuse, NY ($16,687 profit); Boise, ID ($18,662); Lubbock, TX ($19,057), College Station, TX ($19,833) and Amarillo, TX ($20,875).
Almost two-thirds of flipped homes purchased with cash by investors
Nationwide, 62.7 percent of homes flipped in the first quarter of 2022 had been purchased by investors with cash. That figure was virtually unchanged from 62.9 percent in the fourth quarter of 2021, but up from 60.9 percent in the first quarter of 2021. Meanwhile, 37.3 percent of homes flipped in the first quarter of 2022 had been bought with financing. That was about the same as the 37.1 percent portion in the prior quarter, but down from 39.1 percent a year earlier.
“As interest rates continue to go up, cash buyers should be in an even greater position of competitive advantage in the fix-and-flip market,” Sharga noted. “It will be interesting to see if the percentage of cash purchases, and purchases made by larger, better capitalized investors, increases over the next few quarters.”
Among metropolitan areas with a population of 1 million or more and sufficient data to analyze, those with the highest percentage of flips in the first quarter of 2022 that had been purchased with cash were in Buffalo, NY (86.4 percent); Detroit, MI (84 percent); Tucson, AZ (78.1 percent); Cincinnati, OH (76.5 percent) and Raleigh, NC (76.5 percent)
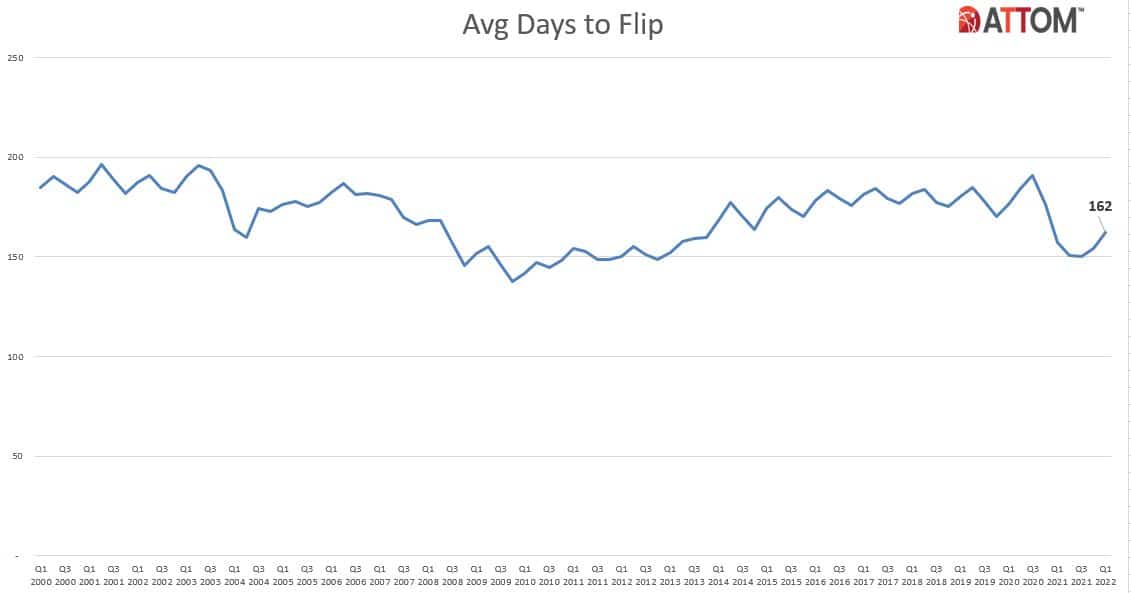
Average time to flip nationwide rises slightly
Home flippers who sold properties in the first quarter of 2022 took an average of 162 days to complete the transactions. While that was less the historical averages, it was still up from an average of 154 in the fourth quarter of 2021 and 157 in the first quarter of 2021.
Investor resales to FHA buyers remain low
Of the 114,706 U.S. homes flipped in the first quarter of 2022, only 7.9 percent were sold to buyers using loans backed by the Federal Housing Administration (FHA). That was down slightly from 8 percent in the prior quarter and down from 9.5 percent in the first quarter of 2021, to the third-lowest quarterly mark since 2007.
Among the 191 metro areas with a population of at least 200,000 and at least 50 home flips in the first quarter of 2022, those with the highest percentage of flipped properties sold to FHA buyers — typically first-time home purchasers — were Visalia, CA (26.6 percent); Lake Charles, LA (23.2 percent); Springfield, MA (22.2 percent); Hagerstown, MD (22.2 percent) and Yuma, AZ (21.7 percent).
Report methodology
ATTOM analyzed sales deed data for this report. A single-family home or condo flip was any arms-length transaction that occurred in the quarter where a previous arms-length transaction on the same property had occurred within the last 12 months. The average gross flipping profit is the difference between the purchase price and the flipped price (not including rehab costs and other expenses incurred, which flipping veterans estimate typically run between 20 percent and 33 percent of the property’s after-repair value). Gross flipping return on investment was calculated by dividing the gross flipping profit by the first sale (purchase) price.
About ATTOM
ATTOM powers innovation across industries with premium property data and analytics covering 158 million U.S. properties—99% of the population. Our multi-sourced real estate data includes property tax, deed, mortgage, foreclosure, environmental risk, natural hazard, neighborhood and geospatial boundary information, all validated through a rigorous 20-step process and linked by a unique ATTOM ID.
From flexible delivery solutions—such as Property Data APIs, Bulk File Licenses, Cloud Delivery, Real Estate Market Trends—to AI-Ready datasets, ATTOM fuels smarter decision-making across industries including real estate, mortgage, insurance, government, and more.
Media Contact:
Christine Stricker
949.748.8428
christine.stricker@attomdata.com
Data and Report Licensing:
949.502.8313