Fresh off the heels of ATTOM Data Solutions’ Year-End 2019 U.S. Home Flipping Report released this week, ATTOM decided to take a deep dive into the demographics within the top metro areas seeing more home flips and here is what we found.
According to ATTOM’s latest year-end home flipping report, U.S. single family homes and condos flipped in 2019 reached the highest point since 2006 – there were 245,864 home flips. That number represented 6.2 percent of all home sales in the nation during the year, an 8-year high. That rate was up from 5.8 percent in 2018 and from 5.7 percent in 2017.
Drilling down to the metro area, home flips as a portion of all home sales increased from 2018 to 2019 in 122 of the 190 metro areas analyzed in the report (64.2 percent). The largest annual increases in the home flipping rate came in Laredo, TX (up 103.5 percent); Raleigh, NC (up 59.8 percent); Charlotte, NC (up 44.1 percent); Fort Smith, AR (up 43.2 percent) and Columbus, GA (up 40.5 percent). Metro areas qualified for the report if they had a population of at least 200,000 and at least 100 home flips in 2019.
Millennials and Baby Boomers
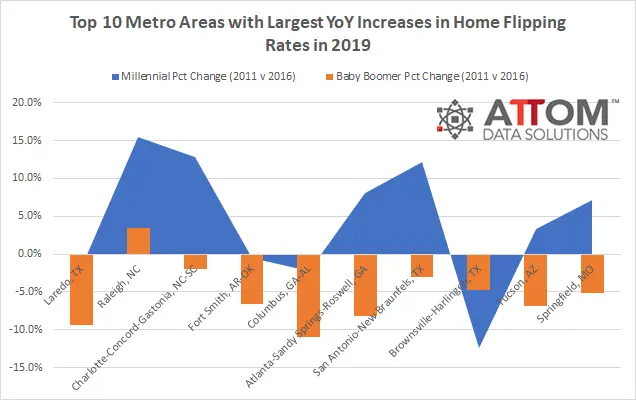
In terms of the demographic data we looked at from 2011-2016, here are the increases and decreases in millennials and baby boomers in these same areas, along with the complete list of the top 10 metro areas seeing the highest flipping rates with at least 200,000 people and 100 home flips in 2019: Laredo, TX – millennials down 1.6 percent, baby boomers down 9.4 percent; Raleigh, NC – millennials up 15.4 percent, baby boomers up 3.5 percent; Charlotte-Concord-Gastonia, NC-SC – millennials up 12.9 percent; baby boomers down 2.0 percent; Fort Smith, AR-OK – millennials down 0.5 percent, baby boomers down 6.6 percent; Columbus, GA-AL – millennials down 2.2 percent, baby boomers down 10.9 percent; Atlanta-Sandy Springs-Roswell, GA – millennials up 8.0 percent, baby boomers down 8.2 percent; San Antonio-New Braunfels, TX – millennials up 12.2 percent, baby boomers down 3.0 percent; Brownsville-Harlingen, TX – millennials down 12.4 percent, baby boomers down 4.7 percent; Tucson, AZ – millennials up 3.3 percent; baby boomers down 6.9 percent; and Springfield, MO – millennials up 7.1 percent, baby boomers down 5.2 percent.

Also according to the report, aside from Raleigh, NC, and Charlotte, NC, the biggest annual flipping-rate increases in MSAs with a population of 1 million or more were in Atlanta, GA (up 39.1 percent); San Antonio, TX (up 37.2 percent) and Tucson, AZ (up 34.2 percent).
ATTOM’s report noted that biggest decrease in annual flipping rates among MSAs with a population of 1 million or more were in Seattle, WA (down 16.9 percent); Indianapolis, IN (down 9.1 percent); Grand Rapids, MI (down 8.0 percent); Rochester, NY (down 5.9 percent) and Baltimore, MD (down 4.8 percent).
And, while flipping activity rose, profit margins continued dropping. Homes flipped in 2019 typically generated a gross profit of $62,900 nationwide (the difference between the median sales price and the median paid by investors), down 3.2 percent from $65,000 in 2018 year and 6 percent from the post-recession peak of $66,899 in 2017.
Also in terms of profits, the typical gross flipping profit of $62,900 translated into a 40.6 percent return on investment compared to the original acquisition price. That was down from a 45.8 percent gross flipping ROI in 2018 and down from 51.4 percent ROI in 2017. The latest typical return on home flips stood at the lowest point since 2011.
Want to learn more about how home flipping rates, profits and demographics might be significant your area? Contact us to find out how!