ATTOM Data Solutions’ newly released Q2 2020 U.S. Home Flipping Report reveals that both home flipping profits and profit margins were up nationwide in the second quarter of 2020, despite a decrease in the U.S. home flipping rate.
According to ATTOM’s latest home flipping analysis, the gross profit on the typical home flip nationwide (the difference between the median sales price and the median paid by investors) increased in Q2 2020, to $67,902. That number was up from $63,000 in Q1 2020 and from $61,900 in Q2 2019.
That increase translates into a 41.3 percent return on investment compared to the original acquisition price. The gross flipping ROI in Q2 2020 was up from 38.9 percent in Q1 2020 and 40.4 percent in Q2 2019. The report notes that typical ROI improvement marked the first quarterly increase since Q3 2018 and the first year-over-year gain since Q4 2017.
ATTOM’s Q2 2020 home flipping analysis reports that 53,621 single-family homes and condominiums in the U.S. were flipped in Q2, representing 6.7 percent of all home sales, or one in 15 transactions. That figure was down from 7.5 percent of all home sales in Q1 2020, or one in 13, but up from 6.1 percent, or one in 17 sales, in Q2 2019.
On the metro area level, the report notes that as the Coronavirus pandemic upended the Spring buying season, home flips as a portion of all home sales decreased from Q1 2020 to Q2 2020 in 75.5 percent of the metros analyzed with a population of 200,000 or more and at least 50 home flips in Q2 2020.
According to the report, among those metros, the largest quarterly decreases in the home flipping rate came in Durham, NC (rate down 40.7 percent); Provo, UT (down 36.6 percent); Boston, MA (down 35.1 percent); Denver, CO (down 33.7 percent) and Salt Lake City, UT (down 32 percent).
The report states the biggest increases in home-flipping rates were in Salisbury, MD (rate up 45.8 percent); Fort Myers, FL (up 20.2 percent); Tallahassee, FL (up 16.8 percent); Corpus Christi, TX (up 14.1 percent) and Kennewick, WA (up 12.6 percent).
The report also states that among 695 counties with at least 10 home flips in Q2 2020, there were 89 where those transactions comprised at least 10 percent of all home sales. The top five were Franklin County (Frankfort), KY (27.8 percent); Clayton County, GA, in the Atlanta metro area (21.4 percent); Macon County, TN, in the Nashville metro area (18.6 percent); Portsmouth City/County, VA, in the Virginia Beach metro area (17.5 percent) and Craven County (New Bern), NC (16.4 percent).
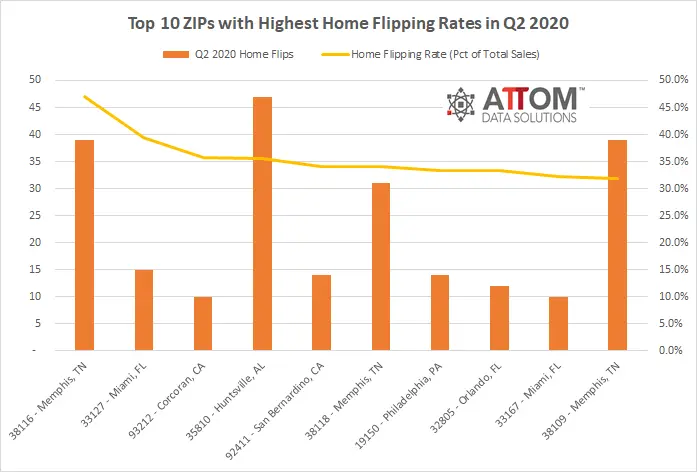
In drilling down to the zip code level, in this post we uncover those zips that saw the highest home flipping rates in Q2 2020 (among zips with 10 or more flips during the quarter). Those zip codes include: 38116 in Memphis, TN (47.0 percent); 33127 in Miami, FL (39.5 percent); 93212 in Corcoran, CA (35.7 percent); 35810 in Huntsville, AL (35.6 percent); 92411 in San Bernardino, CA (34.1 percent); 38118 in Memphis, TN (34.1 percent); 19150 in Philadelphia, PA (33.3 percent); 32805 in Orlando, FL (33.3 percent); 33167 in Miami, FL (32.3 percent); and 38109 in Memphis, TN (32.0 percent).

ATTOM’s Q2 2020 home flipping analysis also reports that home flippers who sold homes in Q2 2020 took an average of 183 days to complete the transactions, up from an average of 174 in Q1 2020 but down from 184 days in Q2 2020.
Another high-level take away from the report is that of the 53,621 U.S. homes flipped in Q2 2020, 15.6 percent were sold to buyers using a loan backed by the Federal Housing Administration (FHA). That number is up from 15.2 percent in Q1 2020 and from 13.8 percent in Q2 2019, to the highest point since Q2 2017.
Want to learn more about home flipping trends in your area? Contact us to find out how!
