ATTOM’s just released Q2 2021 U.S. Home Equity and Underwater Report reveals that 34.4 percent of mortgaged residential properties in the U.S. – one in three – were considered equity-rich in Q2 2021. That figure was up from 31.2 percent in Q1 2021 and from 27.5 percent in Q2 2020.
Also, according to ATTOM’s latest home equity and underwater analysis, just 4.1 percent of mortgaged homes – one in 24 – were considered seriously underwater in Q2 2021, down from 5.2 percent of all U.S. properties with a mortgage in Q1 2021 and 6.2 percent in Q2 2020.
ATTOM’s home equity and underwater report provides counts of properties based on several categories of equity — or loan to value (LTV) — at the state, metro, county and zip code level, along with the percentage of total properties with a mortgage that each equity category represents. The equity/LTV is calculated based on record-level loan model estimating position and amount of loans secured by a property and a record-level automated valuation model (AVM) derived from publicly recorded mortgage and deed of trust data collected and licensed by ATTOM Data Solutions nationwide for more than 155 million U.S. properties.
ATTOM’s Q2 2021 U.S. home equity and underwater report notes that across the country, 48 states saw equity-rich levels increase and seriously underwater percentages decrease from the Q1 to Q2 2021, while every state saw equity-rich levels rise and the seriously underwater portion drop compared to Q2 2020.
The analysis found that nine of the 10 states with the biggest gains in the share of equity-rich homes from Q1 2021 to Q2 2021 were in the West and Northeast, with the biggest increases led by Arizona – where the portion of mortgaged homes considered equity-rich rose from 16.3 percent in Q1 2021 to 39.7 percent in Q2 2021 – followed by Massachusetts (up from 25.3 percent to 41.7 percent), New Hampshire (up from 20.4 percent to 36.1 percent), Rhode Island (up from 21 percent to 36.4 percent) and Delaware (up from 10.5 percent to 25.2 percent).
Also according to the Q2 2021 report, the West again had far higher levels of equity-rich properties than other regions in Q2 2021, with seven of the top eight states posting the highest levels including Idaho (54.2 percent of mortgaged homes were equity-rich), California (53.8 percent), Vermont (53.3 percent), Washington (49.4 percent) and Utah (45.5 percent).
The report notes that among 106 metro areas with a population greater than 500,000, nine of the 10 with the highest shares of mortgaged properties that were equity-rich in Q2 2021 also were in the West, led by San Jose, CA (69.4 percent equity-rich); San Francisco, CA (64.9 percent); Los Angeles, CA (57.9 percent); Boise, ID (57.4 percent) and San Diego, CA (54.3 percent). While the leader in the Northeast region was Boston, MA (43.9 percent), while Austin, TX, again led the South (52.3 percent) and Grand Rapids, MI, continued to top the Midwest (37.2 percent).
In drilling down to the county-level, among U.S. counties with at least 2,500 homes with mortgages in Q2 2021, those with the highest share of equity-rich properties were San Mateo County, CA (outside San Francisco) (74 percent equity-rich); Santa Clara County (San Jose), CA (70.2 percent); Dukes County (Martha’s Vineyard), MA (67.5 percent); Nantucket County, MA (66.4 percent) and Alameda County (Oakland), CA (66.2 percent).
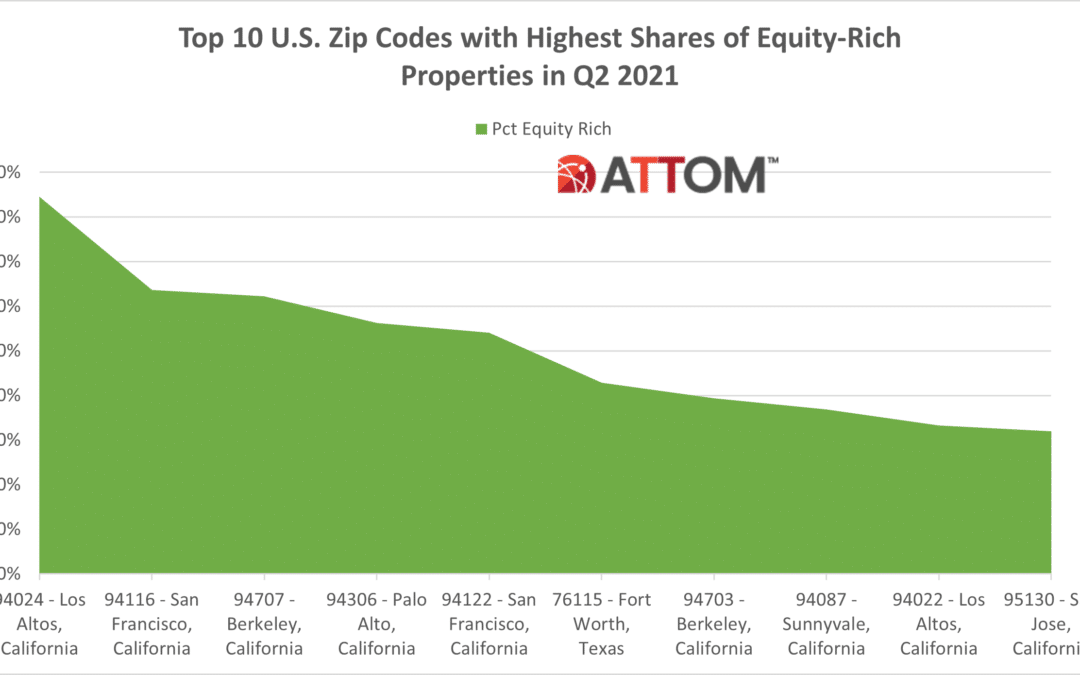
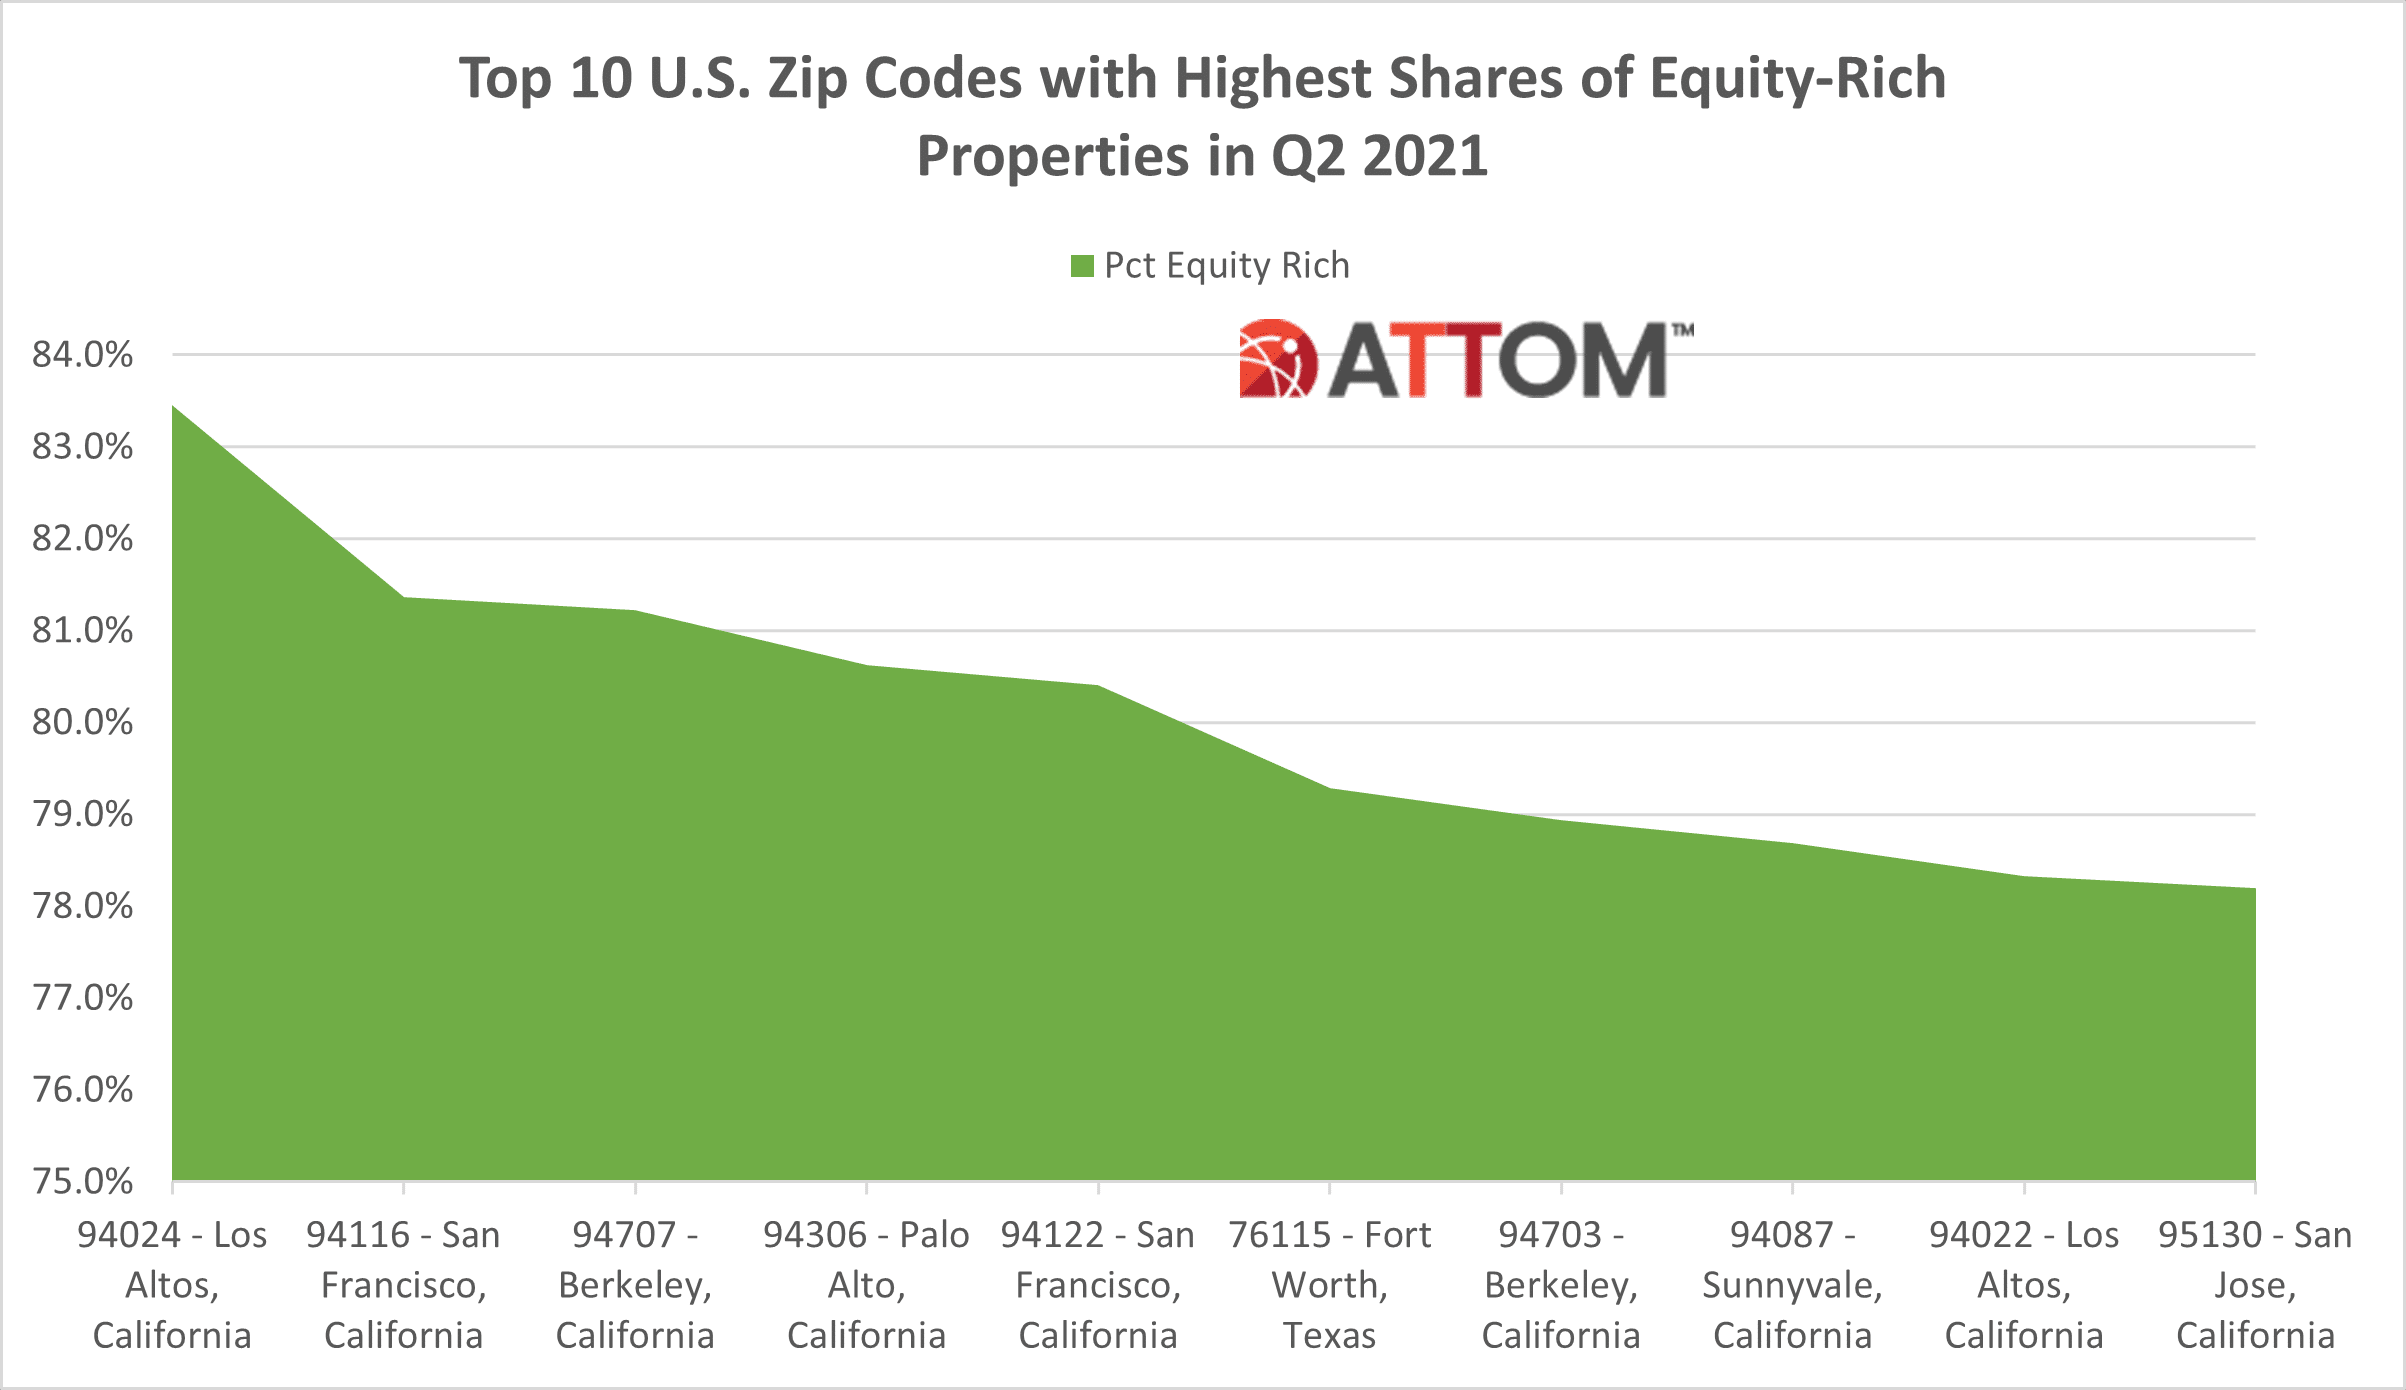
In drilling down even further to the zip code level, ATTOM’s Q2 2021 U.S. home equity and underwater analysis found that 47 of the top 50 were in California, again clustered in the San Francisco Bay area – led by zip codes 94024 in Los Altos, CA (83.5 percent of mortgaged properties were equity-rich); 94116 in San Francisco, CA (81.4 percent); 94707 in Berkeley, CA (81.2 percent); 94306 in Palo Alto, CA (80.6 percent) and 94122 in San Francisco, CA (80.4 percent).
In this post, we dig even deeper into the data behind this analysis to uncover the complete list of the top 10 U.S. zip codes with the highest levels of equity-rich properties in Q2 2021. Rounding out the top 10 are: 76115 in Fort Worth, TX (79.3 percent); 94703 in Berkeley, CA (78.9 percent); 94087 in Sunnyvale, CA (78.7 percent); 94022 in Los Altos, CA (78.3 percent); and 95130 in San Jose, CA (78.2 percent).
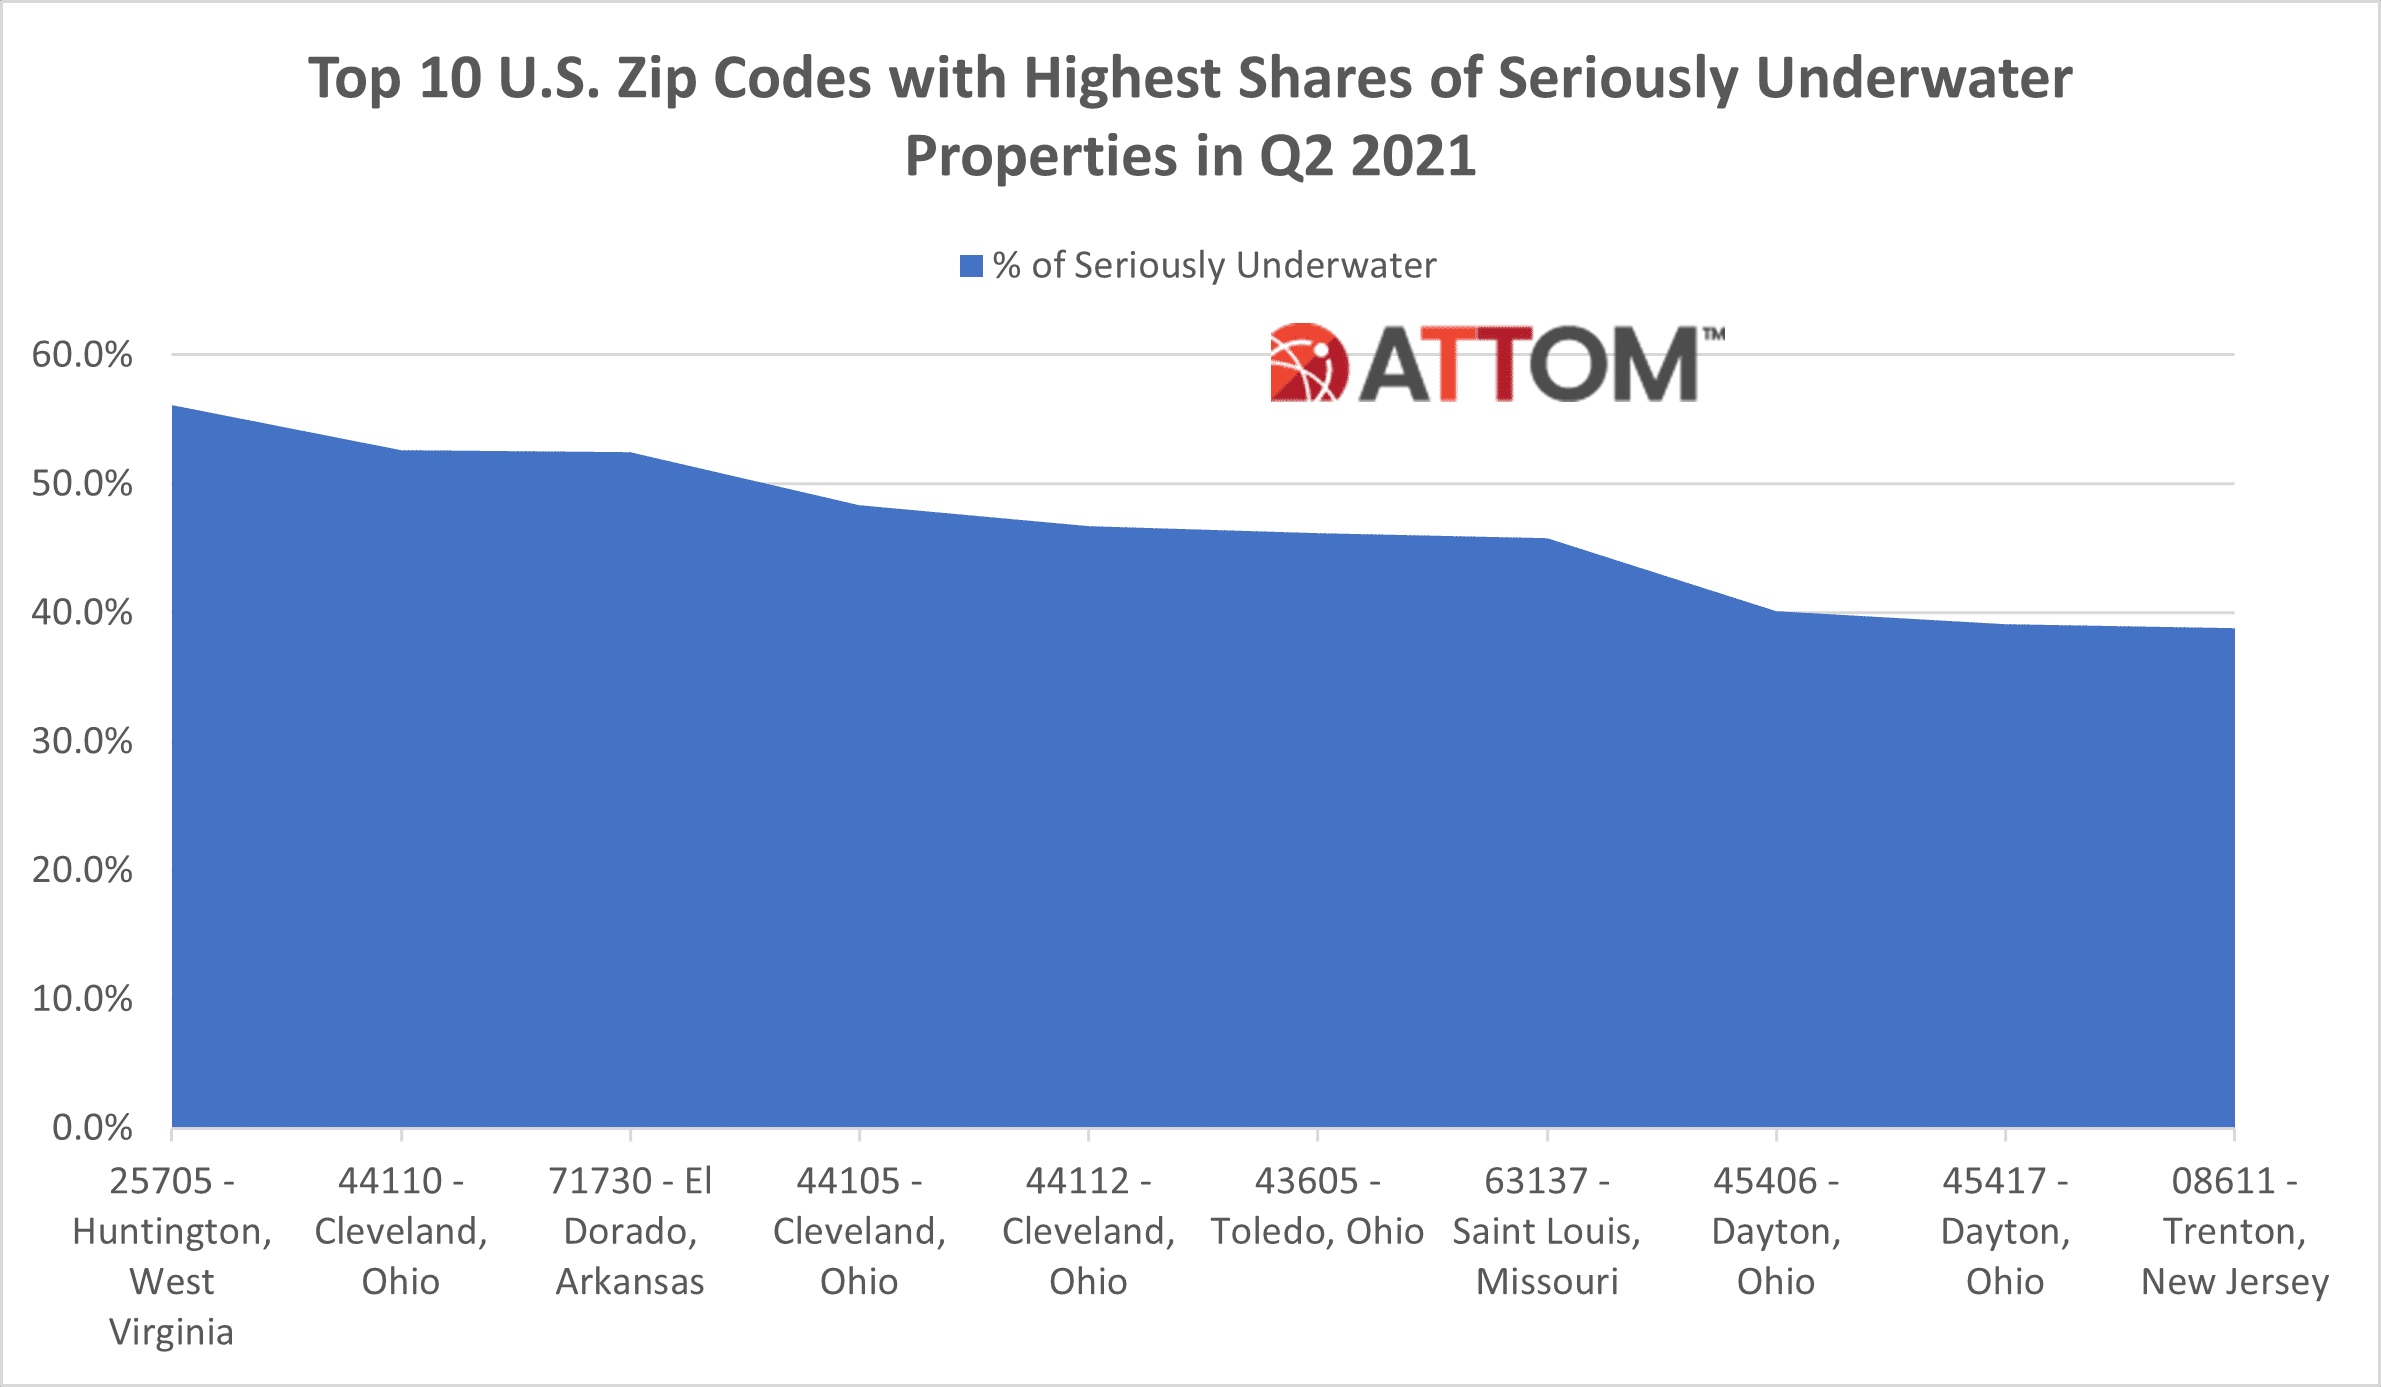
Also in this post, we dig even deeper into the data behind our Q2 2021 U.S. home equity and underwear analysis – on the flip side – to uncover those top 10 U.S. zip codes with the highest levels of seriously underwater properties in Q2 2021. Those zips include: 25705 in Huntington, WV (56.1 percent); 44110 in Cleveland, OH (52.6 percent); 71730 in El Dorado, AR (52.4 percent); 44105 in Cleveland, OH (48.4 percent); 44112 in Cleveland, OH (46.7 percent); 43605 in Toledo, OH (46.2 percent); 63137 in Saint Louis, MO (45.8 percent); 45406 in Dayton, OH (40.1 percent); 45417 in Dayton, OH (39.1 percent); and 08611 in Trenton, NJ (38.8 percent).
Want to see how your area fares in equity-rich or underwater properties share? Contact us to find out how!
