The main takeaway from ATTOM Data Solutions’ newly released Q1 2020 U.S. Home Flipping Report is the home flipping rate nationwide increased to a 14-year high in the first quarter of 2020, while returns slumped to a nine-year low.
ATTOM’s most recent home flipping analysis reported that 53,705 single-family homes and condos in the U.S. were flipped in Q1 2020, representing 7.5 percent of all home sales during the quarter, reaching the highest level since Q2 2006.
According to ATTOM’s Q1 2020 home flipping report, the gross profit on the typical home flip nationwide also increased in the first quarter of 2020, to $62,300, up slightly from $62,000 in Q4 2019 and from $60,675 in Q1 2019. But with home prices rising, that profit translated into only a 36.7 percent return on investment compared to the original acquisition price. The report stated this latest profit margin sits at the lowest level for home flipping since the Q3 2011.
The report noted this pattern of investors unable to fully keep pace with soaring home prices revealed a soft spot in the nation’s nine-year market boom, just as the major impact of the worldwide Coronavirus began damaging the U.S. economy. While it remains unclear how hard the housing market will get hit by the pandemic fallout, a drop in prices could further erode investor profits and cloud the future of the home-flipping industry.
Among the other high-level findings included in ATTOM’s Q1 2020 home flipping report, was that home flipping rates are up in 87 percent of local markets, with the largest quarterly increases in Boston, MA (up 80.2 percent); Springfield, MA (up 76 percent); Olympia, WA (up 73 percent); York, PA (up 71.4 percent) and Minneapolis, MN (up 69.3 percent). Aside from Boston, MA, and Minneapolis, MN, the biggest quarterly flipping-rate increases in metro areas with a population of 1 million or more were in Grand Rapids, MI (up 57.7 percent); Richmond, VA (up 51.3 percent) and Rochester, NY (up 49 percent).
The report also noted that among 1,560 U.S. zip codes with at least 10 or more home flips in Q1 2020, there were 29 zip codes where flips accounted for at least 25 percent of all home sales last year. The top five were 38109 in Shelby County (Memphis), TN (36 percent); 43203 in Franklin County (Columbus), OH (35.7 percent); 90044 in Los Angeles County, CA (35.2 percent); 90222 in Los Angeles County, CA (34.9 percent) and 38680 in DeSoto County, MS (south of Memphis, TN) (32.4 percent).
In terms of home flipping returns at the metro area level, ATTOM’s Q1 2020 home flipping analysis reported that among those metros with a population of at least 1 million where returns on investment increased most were Dallas, TX (up 38 percent); San Antonio, TX (up 36 percent); San Diego, CA (up 20 percent); Chicago, IL (up 20 percent) and Oklahoma City, OK (up 18 percent).
In terms of raw home flipping profits, the report cited the highest profits measured in dollars were concentrated in the West and Northeast. Among those metro areas with enough data to analyze, 13 of the top 15 were in the those regions, led by San Francisco, CA (gross profit of $171,000); San Jose, CA ($165,000); Los Angeles, CA ($145,000); New York, NY ($141,899) and Honolulu, HI ($140,190).
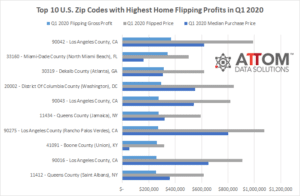
In this post, we unveil the top 10 zip codes with the highest home flipping profits reported in Q1 2020. Those zips include: 90042 – Los Angeles County, CA (gross profit of $369,000); 33160 – Miami-Dade County (North Miami Beach), FL ($342,500); 30319 – Dekalb County (Atlanta), GA ($312,500); 20002 – District Of Columbia County (Washington), DC ($295,000); 90043 – Los Angeles County, CA ($275,000); 11434 – Queens County (Jamaica), NY ($272,700); 90275 – Los Angeles County (Rancho Palos Verdes), CA ($272,500); 41091 – Boone County (Union), KY ($262,245); 90016 – Los Angeles County, CA ($257,000) and 11412 – Queens County (Saint Albans), NY ($255,000).
ATTOM’s Q1 2020 home flipping report also examined average time to flip, as well as flip acquisition and disposition trends.
Want to learn more about home flipping trends in your area? Contact us to find out how!


