ATTOM Data Solutions’ just released 2020 Year-End U.S. Foreclosure Market Report shows that foreclosure filings were reported on 214,323 U.S. properties in 2020. That figure was down 57 percent from 2019 and down 93 percent from a peak of nearly 2.9 million in 2010, to the lowest level since tracking began in 2005.
According to ATTOM’s most recent foreclosure market analysis, those 214,323 properties with foreclosure filings in 2020 represented 0.16 percent of all U.S. housing units, down from 0.36 percent in 2019 and down from a peak of 2.23 percent in 2010.
The analysis also revealed that in December 2020, there were 10,876 U.S. properties with foreclosure filings, up 8 percent from the previous month but down 80 percent from a year ago.
ATTOM’s year-end foreclosure report provides a unique count of properties with a foreclosure filing during the year based on publicly recorded and published foreclosure filings collected in more than 2,200 counties nationwide, with address-level data on nearly 25 million foreclosure filings historically.
The 2020 year-end report noted that at the state level, those with the highest foreclosure rates in 2020 were Delaware (0.33 percent of housing units with a foreclosure filing); New Jersey (0.31 percent); Illinois (0.30 percent); Maryland (0.26 percent); and South Carolina (0.24 percent).
The report also noted that rounding out the top 10 states with the highest foreclosure rates in 2020 were Florida (0.23 percent); Connecticut (0.22 percent); Ohio (0.21 percent); Georgia (0.19 percent); and Indiana (0.18 percent).
ATTOM’s 2020 year-end foreclosure market analysis also reported on the larger metro area trends, including those that saw a year-over-year increase in REOs, as well as those with the highest foreclosure rates in 2020. Among those metros with a population of 200,000 or more, those with the highest rates included Peoria, Illinois (0.48 percent of housing units with a foreclosure filing); Rockford, Illinois (0.44 percent); Trenton, New Jersey (0.44 percent); Atlantic City, New Jersey (0.40 percent); and McAllen, Texas (0.35 percent).
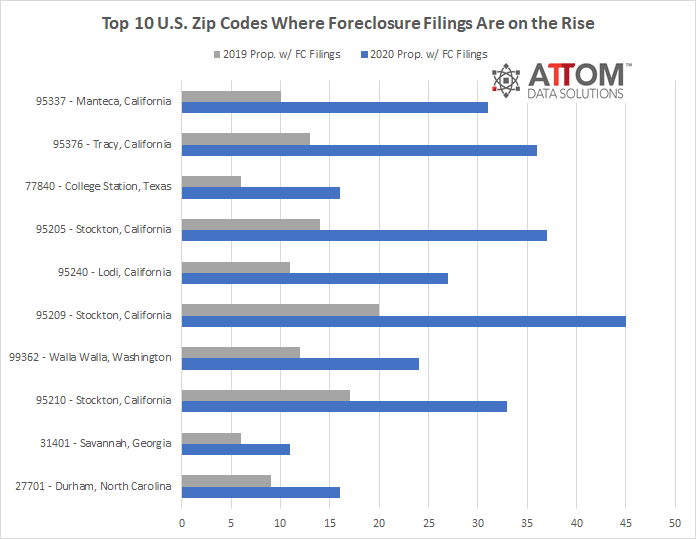
In this post, we dig deeper into the data behind the 2020 year-end foreclosure market report, to uncover the U.S. zip codes where foreclosure filings have come closest to doubling annually. Those top 10 zip codes, among the largest with 10,000 or more housing units and properties with 10 or more foreclosure filings in 2020, include: 95337 in Manteca, California (increased 210 percent from 2019); 95376 in Tracy, California (increased 177 percent); 77840 in College Station, Texas (increased 167 percent); 95205 in Stockton, California (increased 164 percent); 95240 in Lodi, California (increased 145 percent); 95209 in Stockton, California (increased 125 percent); 99362 in Walla Walla, Washington (increased 100 percent); 95210 in Stockton, California (increased 94 percent); 31401 in Savannah, Georgia (increased 83 percent); and 27701 in Durham, North Carolina (increased 78 percent).
ATTOM’s latest foreclosure analysis also reported that U.S. properties foreclosed in the fourth quarter of 2020 had been in the foreclosure process an average of 857 days, a 3 percent increase from the previous quarter and from a year ago.
The report also noted that the states with the longest average time to foreclose in Q4 2020 were Hawaii (2,186 days); New York (1,465 days); Kentucky (1,390 days); Pennsylvania (1,275 days); and Massachusetts (1,223 days).
Want to learn more about annual foreclosure trends in your area? Contact us to find out how!