ATTOM Data Solutions just released its August 2019 foreclosure data analysis revealing 53,007 U.S. properties receiving a foreclosure filing in August, is up 4 percent from July 2019 but down 24 percent from a year ago.
The analysis noted that nationally, one in every 2,554 U.S. properties received a foreclosure filing during the month of August. According to the analysis, the states with the worst foreclosure rates in August 2019 were Delaware (one in every 1,106 housing units); New Jersey (one in every 1,192 housing units); Maryland (one in every 1,218 housing units); Illinois (one in every 1,562 housing units); and Florida (one in every 1,633 housing units).
And at the metro level, those with at least 200,000 people, the areas with the worst foreclosure rates in August 2019 were Trenton, New Jersey (one in every 543 housing units); Atlantic City, New Jersey (one in every 794 housing units); Fayetteville, North Carolina (one in every 920 housing units); Cleveland, Ohio (one in every 969 housing units); and Columbia, South Carolina (one in every 1,013 housing units).
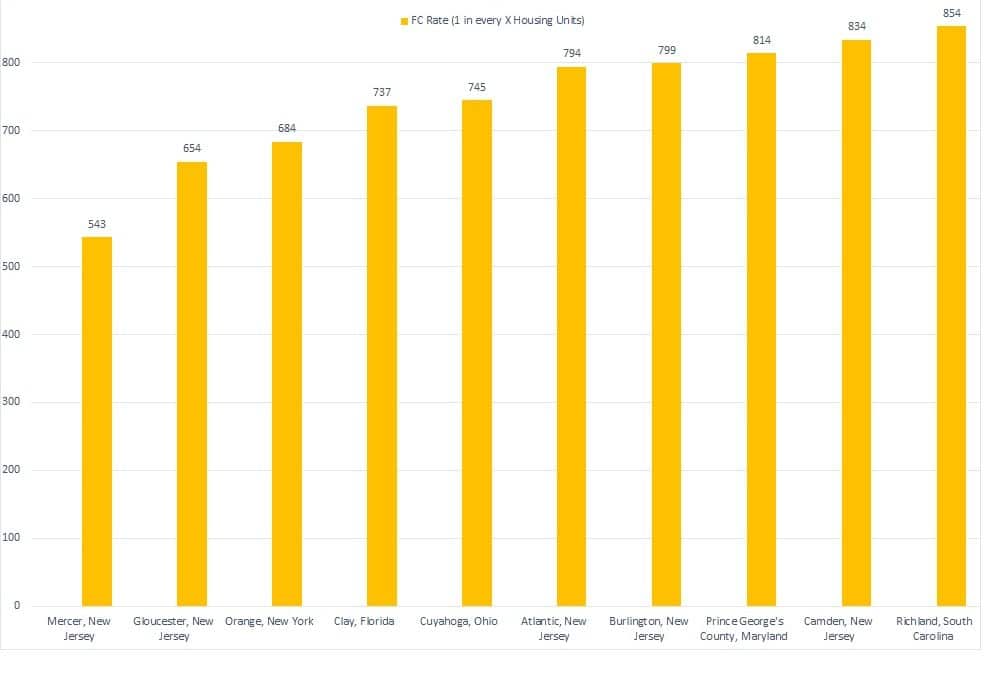
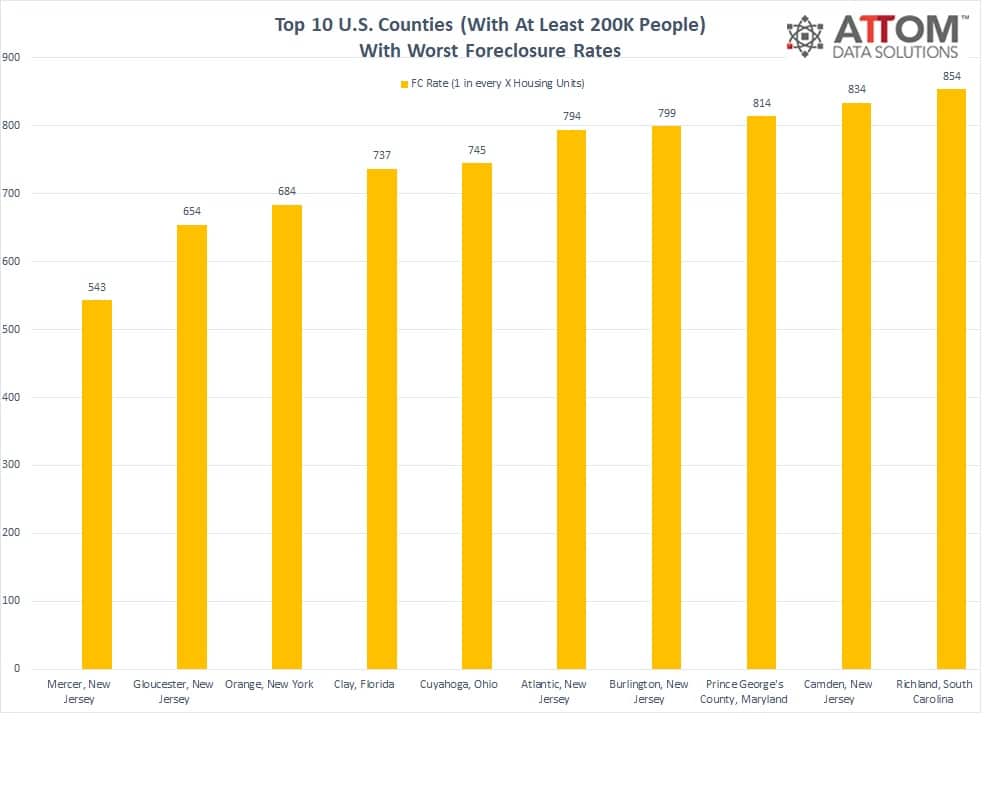
In drilling down to the county level, here are the top 10 U.S. counties with at least 200,000 people, with the worst foreclosure rates: Mercer, New Jersey (one in every 543 housing units); Gloucester, New Jersey (one in every 654 housing units); Orange, New York (one in every 684 housing units); Clay, Florida (one in every 737 housing units); Cuyahoga, Ohio (one in every 745 housing units); Atlantic, New Jersey (one in every 794 housing units); Burlington, New Jersey (one in every 799 housing units); Prince George’s County, Maryland (one in every 814 housing units); Camden, New Jersey (one in every 834 housing units); and Richland, South Carolina (one in every 854 housing units). If you are interested in learning more about our foreclosure statistics, click here.
ATTOM’s August 2019 foreclosure data analysis also stated that among 53 metro areas included in the analysis with at least 1 million people, those with the highest foreclosure rates, including Cleveland, Ohio in August were Jacksonville, Florida (one in every 1,043 housing units); Baltimore, Maryland (one in every 1,116 housing units); Chicago, Illinois (one in every 1,379 housing units); and Philadelphia, Pennsylvania (one in every 1,422 housing units).
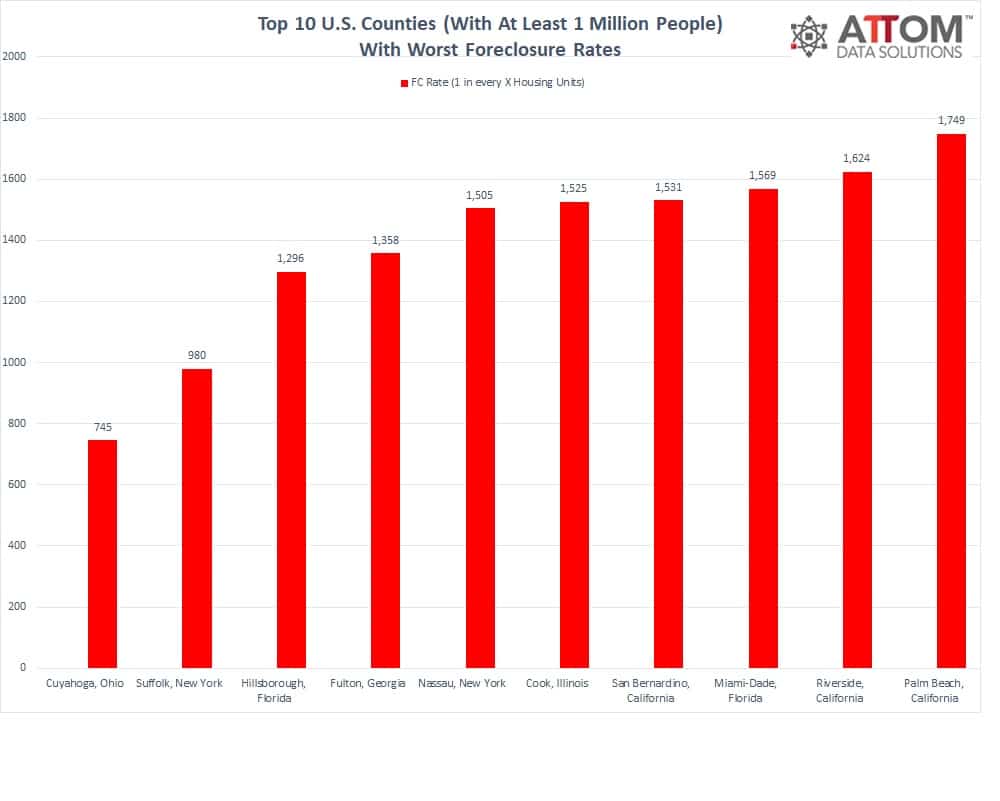
Here are the top 10 U.S. counties with least 1 million people, with the highest foreclosure rates: Cuyahoga, Ohio (one in every 745 housing units); Suffolk, New York (one in every 980 housing units); Hillsborough, Florida (one in every 1,296 housing units); Fulton, Georgia (one in every 1,358 housing units); Nassau, New York (one in every 1,505 housing units); Cook, Illinois (one in every 1,525 housing units); San Bernardino, California (one in every 1,531 housing units); Miami-Dade, Florida (one in every 1,569 housing units); Riverside, California (one in every 1,624 housing units); and Palm Beach, California (one in every 1,749 housing units).
Where does your state, metro area or county rank in foreclosure rate? Contact ATTOM to find out! Foreclosure data by city and zip code level data is also available.