
Foreclosure Starts Increase 7 Percent From Previous Month, Down 15 Percent From Year Ago
There were 53,007 U.S. properties with foreclosure filings in August 2019, up 4 percent from July 2019 but down 24 percent from a year ago. Nationally, one in every 2,554 U.S. properties received a foreclosure filing during the month of August.
Counter to the national trend, 21 states and the District of Columbia posted month-over-month decreases in foreclosure activity in August. Including the District of Columbia (down 49 percent); Alaska (down 30 percent); Arkansas (down 29 percent); Arizona (down 28 percent); and Rhode Island (down 27 percent). If you are interested in learning more about our foreclosure statistics, visit our foreclosure market report page.
Foreclosure starts increase from last month
Lenders started the foreclosure process for the first time on 27,886 property owners in August 2019, up 7 percent from the previous month but down 15 percent from a year ago.
Counter to the national trend, 19 states posted year-over-year increases in foreclosure starts, including Georgia (up 43 percent); Louisiana (up 41 percent); Michigan (up 18 percent); Hawaii (up 13 percent); and Ohio (up 9 percent).
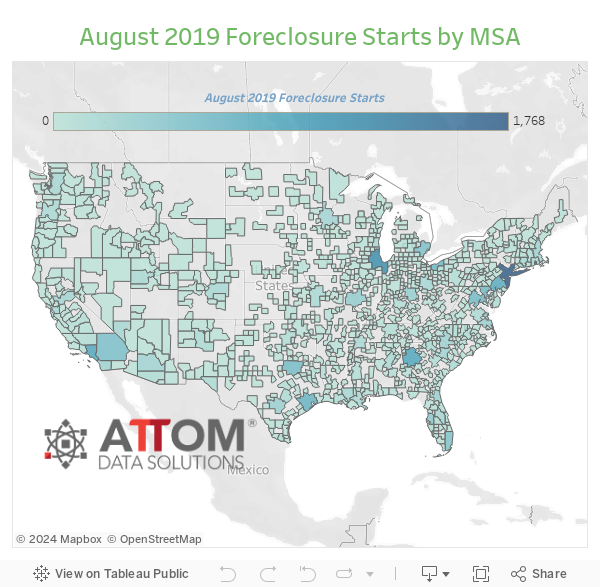
Also, counter to the national trend, 81 of 220 metro areas analyzed posted year-over-year increases in foreclosure starts, including Atlanta, Georgia (up 50 percent); Cleveland, Ohio (up 55 percent); Dallas-Fort Worth, Texas (up 5 percent); Detroit, Michigan (up 18 percent); and Cincinnati, Ohio (up 2 percent).
Delaware, New Jersey, Maryland post worst foreclosure rates
States with the worst foreclosure rates in August 2019 were Delaware (one in every 1,106 housing units); New Jersey (one in every 1,192 housing units); Maryland (one in every 1,218 housing units); Illinois (one in every 1,562 housing units); and Florida (one in every 1,633 housing units).
Among 220 metropolitan statistical areas with at least 200,000 people, those with the worst foreclosure rates in August were Trenton, New Jersey (one in every 543 housing units); Atlantic City, New Jersey (one in every 794 housing units); Fayetteville, North Carolina (one in every 920 housing units); Cleveland, Ohio (one in every 969 housing units); and Columbia, South Carolina (one in every 1,013 housing units).
Among 53 metro areas with at least 1 million people, those with the highest foreclosure rates, including Cleveland, Ohio in August were Jacksonville, Florida (one in every 1,043 housing units); Baltimore, Maryland (one in every 1,116 housing units); Chicago, Illinois (one in every 1,379 housing units); and Philadelphia, Pennsylvania (one in every 1,422 housing units).
Bank repossessions continue to trickle down annually
Lenders repossessed 11,493 U.S. properties in August 2019 (REO), up 4 percent from the previous month but down 47 percent from a year ago, following 10 consecutive months of year-over-year decreases.
Counter to the national trend, 16 out of 220 metro areas analyzed posted year-over-year increases in REOs in August, including Beaumont, Texas (up 81 percent); Honolulu, Hawaii (up 27 percent); Port St. Lucie, Florida (up 27 percent); Salisbury, Maryland (up 19 percent); and Des Moines, Iowa (up 6 percent).
The state of Hawaii (up 8 percent) was the only state to experience an annual increase in completed foreclosures in August. States with the greatest decreases in completed foreclosures in August, included: Kansas (down 92 percent); Mississippi (down 82 percent); Idaho (down 80 percent); Wyoming (down 79 percent); and Utah (down 79 percent).