With 74 percent of U.S. housing markets unaffordable for average wage earners to buy a median-priced home, where are the areas that are still affordable?
As cited in ATTOM Data Solutions’ just released Q3 2019 U.S. Home Affordability Report, the largest populated counties where a median-priced home in Q3 2019 was not affordable for average wage earners included Los Angeles County, CA; Cook County (Chicago), IL; Maricopa County (Phoenix), AZ; San Diego County, CA and Orange County, CA. Those same counties were in the top five in Q2 2019 as well.
As for the other counties analyzed in the report, among the 498 – not just the largest – here are the top 10 where a median-priced home in Q3 2019 was not affordable: Kings County, NY; Santa Cruz County, CA; Marin County, CA; Maui County, HI; Monterey County, CA; San Luis Obispo County, CA; Westchester County, NY; Orange County, CA; Napa County, CA; and San Francisco County, CA.

The report determined affordability for average wage earners by calculating the amount of income needed to make monthly house payments — including mortgage, property taxes and insurance — on a median-priced home, assuming a 3 percent down payment and a 28 percent maximum “front-end” debt-to-income ratio. That required income was then compared to annualized average weekly wage data from the Bureau of Labor Statistics.
Where is buying a home affordable?
According to ATTOM’s report, 26 percent of the counties analyzed, or 127 of 498, where a median-priced home in Q3 2019 was still affordable for average wage earners, included Harris County (Houston), TX; Wayne County (Detroit), MI; Philadelphia County, PA; Cuyahoga County (Cleveland), OH; and Allegheny County (Pittsburgh), PA.
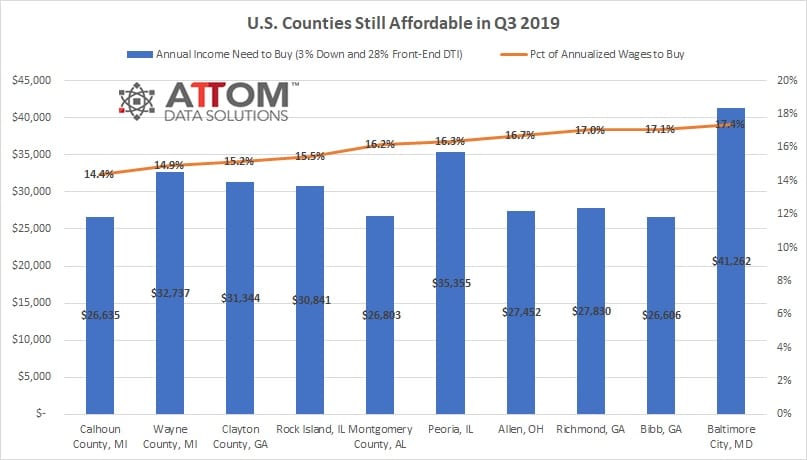
Among the other 498 counties analyzed in the report – not just the largest – here are the top 10 where a median-priced home in Q3 2019 was still affordable: Calhoun County, MI; Wayne County, MI; Clayton County, GA; Rock Island, IL; Montgomery County, AL; Peoria, IL; Allen, OH; Richmond, GA; Bibb, GA; and Baltimore City, MD.
The report also showed that among the 498 counties analyzed, 61 percent (304 counties) were less affordable than their historic affordability averages in Q3 2019, down from 70 percent of counties in Q2 2019 and 73 percent of counties in Q3 2018.
Counties that were less affordable than their historic affordability averages (indexes of less than 100 are considered less affordable compared to their historic averages) with a population greater than 1 million included Los Angeles County, CA (index of 96); Harris County (Houston), TX (89); Maricopa County (Phoenix), AZ (93); Orange County, CA (99); and Miami-Dade County, FL (98).
Among the 498 counties analyzed in the report, 39 percent (194 counties) were more affordable than their historic affordability averages in Q3 2019, including Cook County (Chicago), IL; San Diego County, CA; Queens County, NY; King County (Seattle), WA; and Santa Clara County (San Jose), CA.
Where does your area rank in home affordability? Contact ATTOM to find out!