ATTOM’s just released Q4 2023 U.S. Home Affordability Report revealed that median-priced single-family homes and condos remain less affordable in Q4 2023 compared to historical averages in 99 percent of counties analyzed.
According to ATTOM’s latest home affordability analysis, the most recent trend continues a pattern dating back to 2021 of home ownership requiring historically large portions of wages around the country.
The Q4 2023 affordability report also revealed that major expenses on median-priced homes consume 33.7 percent of the average national wage, a level considered unaffordable by common lending standards.
ATTOM’s latest analysis also found that annual wages of more than $75,000 are needed to pay for major costs on the median-priced homes purchased in Q4 2023 in 57.2 percent of counties analyzed. The report noted that by contrast, just 11 percent of the counties reviewed have average annual wages that high.
Also according to the report, looked at another way, the $86,404 income needed to afford a median-priced home in the U.S. is 20.5 percent more than the latest average national wage.
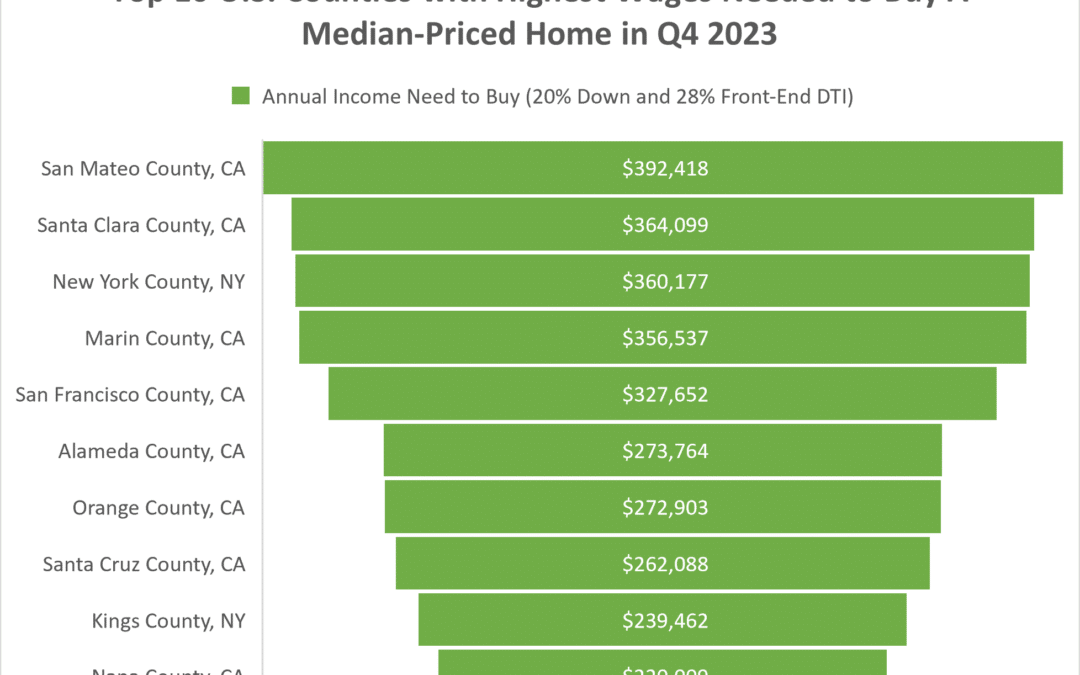
The Q4 2023 affordability report noted that the 20 highest annual wages required to afford typical homes are all on the east or west coasts, led by San Mateo County (outside San Francisco), CA ($392,418); Santa Clara County (San Jose), CA ($364,099); New York County (Manhattan), NY ($360,177); Marin County (outside San Francisco), CA ($356,537) and San Francisco County, CA ($327,652).
The ATTOM report noted that the lowest annual wages required to afford a median-priced home in Q4 of 2023 are in Cambria County, PA (east of Pittsburgh) ($19,978); St. Lawrence County (Canton), NY ($25,275); Schuylkill County, PA (outside Allentown) ($27,325); Mercer County, PA ($27,565) and Macon County (Decatur), IL ($28,655).
In this post, we uncover the complete list of those top 10 U.S. counties with the highest annual wages required to afford typical homes. Those counties rounding out that list include: Alameda County, CA ($273,764); Orange County, CA ($272,903); Santa Cruz County, CA ($262,088); Kings County, NY ($239,462); and Napa County, CA ($220,009).

Also, in this post, we uncover the complete list of those top 10 U.S. counties with the lowest annual wages required to afford typical homes. Those counties rounding out that list include: Montgomery County, AL ($30,851); Fayette County, PA ($31,326); Bay County, MI ($32,169); La Salle County, IL ($32,492); and Robeson County, NC ($32,563).

ATTOM’s home affordability report determines affordability for average wage earners by calculating the amount of income needed to meet major monthly home ownership expenses — including mortgage, property taxes and insurance — on a median-priced single-family home, assuming a 20 percent down payment and a 28 percent maximum “front-end” debt-to-income ratio. That required income is then compared to annualized average weekly wage data from the Bureau of Labor Statistics.
Want to learn more about home affordability in your area? Contact us to find out how!
