
Major Home-Ownership Expenses Again Require One-Third of Average Wage Nationwide, a 16-Year High; Historical Affordability Also Stays at Worst Point Since 2007; But Both Measures End Nearly Three-Year Slide Amid Mixed Trends in Home Prices and Mortgage Rates
IRVINE, Calif. – Dec. 21, 2023 —ATTOM, a leading curator of land, property, and real estate data, today released its fourth-quarter 2023 U.S. Home Affordability Report showing that median-priced single-family homes and condos remain less affordable in the fourth quarter of 2023 compared to historical averages in 99 percent of counties around the nation with enough data to analyze. The latest trend continues a pattern dating back to 2021 of home ownership requiring historically large portions of wages around the country.
WATCH: ATTOM Q4 2023 U.S. HOME AFFORDABILITY REPORT
The report also shows that major expenses on median-priced homes consume 33.7 percent of the average national wage in the fourth quarter – a level considered unaffordable by common lending standards.

Both measures – historical and current affordability – have stayed virtually the same from the third quarter to the fourth quarter of this year after trending consistently against home buyers for almost three years. That has happened as major ownership expenses and wages both are virtually unchanged this quarter.
But the two measures are still worse than they were a year ago and far weaker than in 2021.
For example, the portion of average wages nationwide required for typical mortgage payments, property taxes and insurance are up three percentage points from a year ago and 12 points from early in 2021, right before home-mortgage rates began shooting up from their lowest levels in decades. The latest expense-to-wage ratio continues to sit above the 28 percent level preferred by mortgage lenders and marks the highest point since 2007.
“The good news is that home affordability has stopped getting tougher around the U.S., at least for the moment. The bad news is that owning a home remains more of a financial stretch than it’s been for many years,” said Rob Barber, CEO for ATTOM. “The annual Fall slowdown in the housing market clearly has helped stem the tide working against potential purchasers. Whether that’s just a temporary thing tied to seasonal market patterns is something we won’t know until next year, especially given recent signs that interest rates are coming down. But for now, there is some break into the growing financial stress for house hunters.”
The fourth-quarter trends come at a time of mixed patterns among home prices and home-mortgage interest rates. While average 30-year fixed mortgage rates around the U.S. have grown this quarter from 7.1 to 7.4 percent, the nationwide median home value has slipped almost 3 percent.
Those two factors have helped to keep home ownership expenses steady from the third to the fourth quarter, which has helped to keep those costs from becoming even more unaffordable for average workers. Affordability had worsened almost every prior quarter since early 2021 as wage increases were outpaced by rising interest rates and prices that kept going up amid a decade-long market boom.
Another round of price declines during the annual Winter market contraction combined with interest rate declines that have emerged very recently may help turn the affordability picture back around in favor of buyers.
The report determined affordability for average wage earners by calculating the amount of income needed to meet major monthly home ownership expenses — including mortgage payments, property taxes and insurance — on a median-priced single-family home, assuming a 20 percent down payment and a 28 percent maximum “front-end” debt-to-income ratio. That required income was then compared to annualized average weekly wage data from the U.S. Bureau of Labor Statistics (see full methodology below).
Compared to historical levels, median home ownership costs in 572 of the 580 counties analyzed in the fourth quarter of 2023 are less affordable than in the past. That number is virtually the same as in the third quarter of this year and up slightly from the fourth quarter of last year, but more than double the figure from two years ago.
Meanwhile, the portion of average local wages consumed by major home-ownership expenses on typical homes is considered unaffordable during the fourth quarter of 2023 in more than three-quarters of the 580 counties in the report, based on the 28 percent guideline. Counties with the largest populations that are unaffordable in the fourth quarter are Los Angeles County, CA; Maricopa County (Phoenix), AZ; San Diego County, CA; Orange County, CA (outside Los Angeles) and Kings County (Brooklyn), NY.
The most populous of the 130 counties where major expenses on median-priced homes are still affordable for average local workers in the fourth quarter of 2023 are Cook County (Chicago), IL; Harris County (Houston), TX; Wayne County (Detroit), MI; Philadelphia, County, PA, and Cuyahoga County (Cleveland), OH.
Home prices decline quarterly but remain up annually in three-quarters of local markets
After jumping almost 10 percent during this year’s Spring and Summer home-buying season, the national median price for single-family homes and condos has decreased from $344,670 in the third quarter of 2023 to $335,000 in the fourth quarter. However, it is still up 6 percent from $316,000 in the fourth quarter of 2022.
Data was analyzed for counties with a population of at least 100,000 and at least 50 single-family home and condo sales in the fourth quarter of 2023.
Among the 47 counties in the report with a population of at least 1 million, the biggest year-over-year increases in median prices during the fourth quarter of 2023 are in Orange County, CA (outside Los Angeles) (up 14.7 percent); Fulton County (Atlanta), GA (up 14.7 percent); Broward County (Fort Lauderdale), FL (up 10.6 percent); Santa Clara County (San Jose), CA (up 10.4 percent) and Palm Beach County (West Palm Beach), FL (up 10.4 percent).
Counties with a population of at least 1 million where median prices remain down the most from the fourth quarter of 2022 to the same period this year are New York County (Manhattan), NY (down 10.3 percent); Travis County (Austin), TX (down 3.4 percent); Queens County, NY (down 2.9 percent); Bexar County (San Antonio), TX (down 2.6 percent) and Philadelphia County, PA (down 1.9 percent).
Prices growing faster than wages in half the U.S.
While home values have settled down around the U.S. housing market, annual price changes still have outpaced changes in weekly annualized wages during the fourth quarter of this year in 294, or 50.7 percent, of the 580 counties analyzed in the report. That was down slightly from the fourth quarter of 2022 when prices were growing faster annually than wages in 56 percent of the same counties.
The current group of counties where prices are increasing more than wages annually, or decreasing less, include Los Angeles County, CA; Cook County, (Chicago), IL; San Diego County, CA; Orange County, CA (outside Los Angeles) and Kings County (Brooklyn), NY.
Year-over-year changes in average annualized wages have bested price movements during the fourth quarter of 2023 in 286 of the 580 counties analyzed (49.3 percent). The latest group where wages are increasing more, or declining less, than prices include Harris County (Houston), TX; Maricopa County (Phoenix), AZ; Dallas County, TX; Riverside County, CA, and Queens County, NY.
Portion of wages needed for home ownership still up annually in most of nation
Amid interest rates ticking up but home values inching down, the portion of average local wages consumed by major expenses on median-priced, single-family homes has grown from the third to the fourth quarter of 2023 in just 54.7 percent of the 580 counties analyzed. However, it remains up annually in 88.8 percent of those markets.
The typical $2,016 cost of mortgage payments, homeowner insurance, mortgage insurance and property taxes nationwide consumes 33.7 percent of the average annual national wage of $71,708 this quarter. That remains the same as in the third quarter of 2023, as expenses and average wages both have risen less than 1 percent from the third to the fourth quarter. But the latest portion is up from 30.9 percent in the fourth quarter of last year and is far above the recent low point of 21.4 percent hit in the first quarter of 2021.
The latest figure exceeds the 28 percent lending guideline in 450, or 77.6 percent, of the counties analyzed, assuming a 20 percent down payment. That is virtually unchanged from 78.3 percent of the same group of counties in the third quarter but up from 71 percent two years ago and more than twice the 31 percent level in early 2021.
In slightly more than a third of the markets analyzed, major expenses consume at least 43 percent of average local wages – an amount considered seriously unaffordable.
“This remains among the most important bits of fallout from the double-whammy of higher prices and mortgage rates over the past few years,” Barber said. “Even though there are signs of better times for buyers this quarter, the high expense-to-wage ratio is still a stretch in most of the country for average workers who don’t have a lot of other financial resources like significant savings or investments. Lenders will often push the 28 percent rule, especially if buyers have lots of financial resources outside of wages, we now are seeing fully three-quarters of markets around the country pushing the basic lending benchmark.”
Home ownership on the northeast and west coasts still eats up largest chunk of wages
The top 20 counties where major ownership costs require the largest percentage of average local wages are again in the Northeast or the west coast. The leaders are Kings County (Brooklyn), NY (114 percent of annualized local wages needed to buy a single-family home); Santa Cruz County, CA (112.2 percent); Marin County, CA (outside San Francisco) (109.8 percent); San Luis Obispo County, CA (103.9 percent) and Monterey County, CA (100.8 percent).
Aside from Kings County, those with a population of at least 1 million where major ownership expenses typically consume more than 28 percent of average local wages in the fourth quarter of 2023 include Orange County, CA (outside Los Angeles) (98.9 percent required); Alameda County (Oakland), CA (81 percent); Queens County, NY (80.8 percent) and Nassau County (Long Island), NY (77.2 percent).
Counties where the smallest portion of average local wages are required to afford the median-priced home during the fourth quarter of this year are Cambria County, PA (east of Pittsburgh) (11.8 percent of annualized weekly wages needed to buy a home); Macon County (Decatur), IL (11.8 percent); St. Lawrence County (Canton), NY (12.3 percent); Peoria County, IL (13.5 percent) and Schuylkill County, PA (outside Allentown) (14.7 percent).
Counties with a population of at least 1 million where major ownership expenses typically consume less than 28 percent of average local wages in the fourth quarter of 2023 include Wayne County (Detroit), MI (16 percent); Philadelphia County, PA (18.7 percent); Cuyahoga County (Cleveland), OH (20.2 percent); Allegheny County (Pittsburgh), PA (20.5 percent) and St. Louis County, MO (23.3 percent).
Annual wages of more than $75,000 needed to afford typical home in nearly 60 percent of county markets
Annual wages of more than $75,000 are needed to pay for major costs on the median-priced homes purchased during the fourth quarter of 2023 in 332, or 57.2 percent, of the 580 markets in the report. By contrast, just 11 percent of the counties reviewed have average annual wages that high.
Looked at another way, the $86,404 income needed to afford a median-priced home in the U.S. is 20.5 percent more than the latest average national wage.
The 20 highest annual wages required to afford typical homes are all on the east or west coasts, led by San Mateo County (outside San Francisco), CA ($392,418); Santa Clara County (San Jose), CA ($364,099); New York County (Manhattan), NY ($360,177); Marin County (outside San Francisco), CA ($356,537) and San Francisco County, CA ($327,652).
The lowest annual wages required to afford a median-priced home in the fourth quarter of 2023 are in Cambria County, PA (east of Pittsburgh) ($19,978); St. Lawrence County (Canton), NY ($25,275); Schuylkill County, PA (outside Allentown) ($27,325); Mercer County, PA ($27,565) and Macon County (Decatur), IL ($28,655).
Almost all local markets historically less affordable this quarter
Among the 580 counties analyzed, 572, or 98.6 percent, are less affordable in the fourth quarter of 2023 than their historic affordability averages. That is almost the same as the 98.8 percent level of a year ago but double the 48.7 percent figure from the fourth quarter of 2021. Historical indexes have worsened since the fourth quarter of last year annually in 88.8 percent of those counties, pushing the nationwide index to its lowest point since 2007.
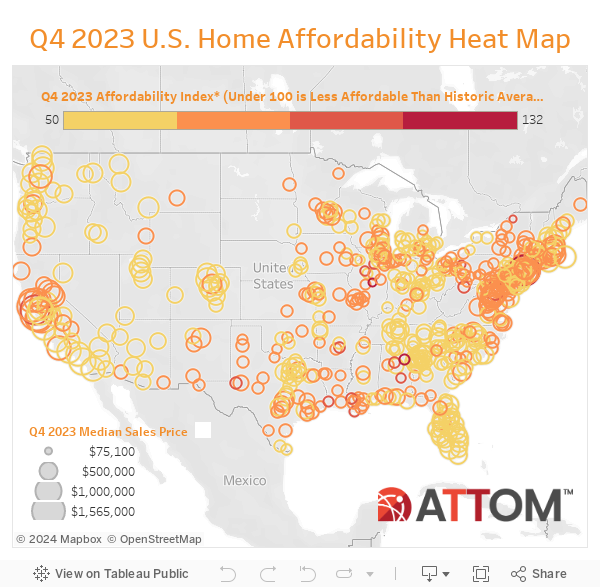
Counties with a population of at least 1 million that are less affordable than their historic averages (indexes of less than 100 are considered historically less affordable) include Fulton County (Atlanta), GA (index of 60); Mecklenburg County (Charlotte), NC (60); Wayne County (Detroit), MI (62); Hillsborough County (Tampa), FL (62) and Collin County (Plano), TX (63).
Counties with the worst affordability indexes in the fourth quarter of 2023 include Newton County, GA (outside Atlanta) (index of 50); Jackson County, MS (index of 50); Paulding County, GA (outside Marietta) (52); St. Lucie County (Port St. Lucie), FL (53) and Forsyth County, GA (outside Atlanta) (54).
Only 1 percent of markets are more affordable than historic averages
Only eight of the 580 counties in the report, (1.4 percent), are more affordable than their historic averages in the fourth quarter of 2023. That is about the same as in the third quarter of this year, but less than the 12.1 percent level a year ago and far worse than the 51.3 percent that were historically more affordable in the fourth quarter of 2021.
Counties that are more affordable in the fourth quarter of this year compared to historical averages include Macon County (Decatur), IL (index of 132); New York County (Manhattan), NY (114); San Francisco County, CA (107); Ector County (Odessa), TX (105) and Mercer County, PA (105).
Report Methodology
The ATTOM U.S. Home Affordability Index analyzed median home prices derived from publicly recorded sales deed data collected by ATTOM and average wage data from the U.S. Bureau of Labor Statistics in 580 U.S. counties with a combined population of 257.3 million during the fourth quarter of 2023. The affordability index is based on the percentage of average wages needed to pay for major expenses on a median-priced home with a 30-year fixed-rate mortgage and a 20 percent down payment. Those expenses include property taxes, home insurance, mortgage payments and mortgage insurance. Average 30-year fixed interest rates from the Freddie Mac Primary Mortgage Market Survey were used to calculate monthly house payments.
The report determined affordability for average wage earners by calculating the amount of income needed for major home-ownership expenses on median-priced homes, assuming a loan of 80 percent of the purchase price and a 28 percent maximum “front-end” debt-to-income ratio. For example, the nationwide median home price of $335,000 in the fourth quarter of 2023 requires an annual wage of $86,404. That is based on a $67,000 down payment, a $268,000 loan and monthly expenses not exceeding the 28 percent barrier — meaning wage earners would not be spending more than 28 percent of their pay on mortgage payments, property taxes and insurance. That required income is more than the $71,708 average wage nationwide, based on the most recent average weekly wage data available from the Bureau of Labor Statistics, making a median-priced home nationwide unaffordable for average workers.
About ATTOM
ATTOM delivers AI-driven property intelligence built on one of the nation's most trusted property data assets, covering 160 million U.S. properties—99% of the population. Our engineered, multi-sourced real estate data spans property tax, deeds, mortgages, foreclosure, environmental risk, property conditions, natural hazards, neighborhood insights, and geospatial boundaries, rigorously validated for advanced analytics. ATTOM supports analytics and AI-driven applications through flexible delivery options including APIs, bulk licensing, cloud delivery, market trend products, and the MCP Server for AI-powered, agentic access to engineered property data—enabling organizations to automate analysis and scale property intelligence across industries.
Media Contact:
Christine Stricker
949.748.8428
christine.stricker@attomdata.com
Data and Report Licensing:
949.502.8313