According to ATTOM Data Solutions’ Q1 2020 U.S. Home Affordability Report released this week, median home prices are unaffordable for average wage earners in 66 percent or 319 of 483 of the U.S. counties analyzed. That figure is down from 70.4 percent in Q4 2019 and 69.8 percent from Q1 2019.
However, the report also shows that owning a median-priced home in Q1 2020 in the U.S. – costing $252,500 – consumes 31.1 percent of the national average wage, down from 31.4 percent in Q4 2019 and 31.6 percent in Q1 2019, to the lowest percentage since Q4 2017 when the average workers were spending 30.8 percent of wages to own a home.
ATTOM’s home affordability reports determine affordability for average wage earners by calculating the amount of income needed to make monthly house payments — including mortgage, property taxes and insurance — on a median-priced home, assuming a 3 percent down payment and a 28 percent maximum “front-end” debt-to-income ratio. That required income was then compared to annualized average weekly wage data from the Bureau of Labor Statistics.
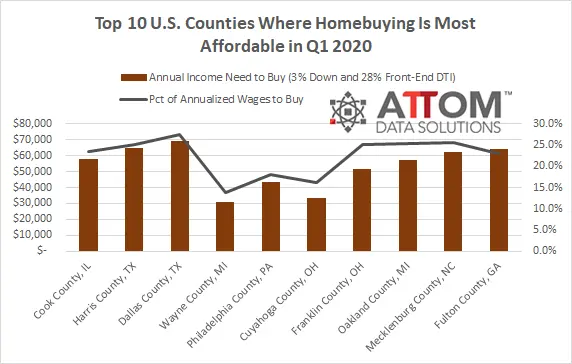
The Q1 2020 affordability analysis noted that the most populous counties where buying a median-priced home is affordable for average wage earners include Cook County (Chicago) IL; Harris County (Houston), TX; Dallas County, TX; Wayne County (Detroit), MI and Philadelphia County, PA. The report analyzed 483 counties with a population of at least 100,000 and at least 100 homes sales in Q1 2020.
Here is the complete list of the top 10 most populous counties where a median-priced home in Q1 2020 is most affordable: Cook County, IL (23.5 percent of annualized wages needed to buy); Harris County, TX (25.1 percent); Dallas County, TX (27.5 percent); Wayne County, MI (13.9 percent); Philadelphia County, PA (18.0 percent); Cuyahoga County, OH (16.1 percent); Franklin County, OH (25.1 percent); Oakland County, MI (25.4 percent); Mecklenburg County, NC (25.6 percent); and Fulton County, GA (23.1 percent).

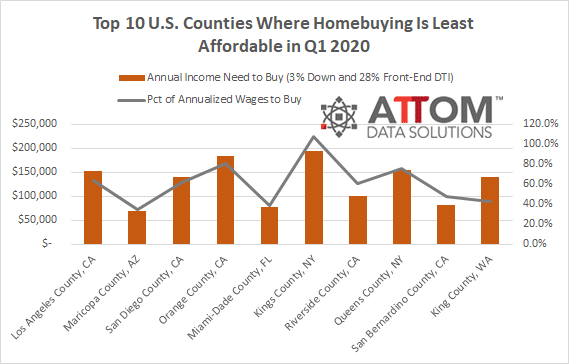
On the least affordable side of the analysis, the report stated that buying a median-priced home in Q1 2020 was not affordable for average wage earners in 34 percent (or 164 of 483) of the counties, including Los Angeles County, CA; Maricopa County (Phoenix), AZ; San Diego County, CA; Orange County, CA (in the Los Angeles, CA metropolitan statistical area) and Miami-Dade County, FL.
Here is the complete list of the top 10 most populous counties where a median-priced home in Q1 2020 is least affordable: Los Angeles County, CA (64.1 percent of annualized wages needed to buy); Maricopa County, AZ (35.2 percent); San Diego County, CA (62.1 percent); Orange County, CA (80.3 percent); Miami-Dade County, FL (39.1 percent); Kings County, NY (108.1 percent); Riverside County, CA (61.0 percent); Queens County, NY (75.8 percent); San Bernardino County, CA (47.8 percent); and King County, WA (42.8 percent).
ATTOM’s Q1 2020 home affordability analysis also reported that 66.9 percent of U.S. counties (or 323 of 483) are more affordable than their historic affordability averages, up from 55.1 percent in Q4 2019 and 49.7 percent from Q1 2019. Among the counties analyzed, 33.1 percent (or 160 of 483) are less affordable than their historic affordability averages in Q1 2020, down from 44.9 percent of counties in Q4 2019 and 50.3 percent in Q1 2019.
The report also noted that annual home price appreciation is outpacing average weekly wage growth in 64 percent (or 309 of the 483) of the counties analyzed, with the largest counties including Los Angeles County, CA; Maricopa County (Phoenix), AZ; San Diego County, CA; Orange County, CA (in the Los Angeles, CA metro area) and Miami-Dade County, FL.
Want to learn more about home affordability trends in your area? Contact us to