ATTOM’s newly released Q2 2021 U.S. Home Affordability Report shows that median home prices of single-family homes and condos in Q2 2021 are less affordable than historical averages in 61 percent of the U.S. counties analyzed. The report noted that figure was up from 48 percent in Q2 2020, to the highest point in two years, as home prices have increased faster than wages in much of the country.
The latest home affordability analysis conducted by ATTOM, reported that the pattern of home prices still manageable but getting less affordable, has resulted in major ownership costs on the typical home consuming 25.2 percent of the average national wage of $63,986 in Q2 2021. That figure is up from 22.7 percent in Q1 2021 and 22.2 percent in Q2 2020, to the highest point since Q3 2008. However, that level is still within the 28 percent standard lenders prefer for how much homeowners should spend on mortgage payments, home insurance and property taxes.
ATTOM’s home affordability report determines affordability for average wage earners by calculating the amount of income needed to meet monthly home ownership expenses — including mortgage, property taxes and insurance — on a median-priced single-family home, assuming a 20 percent down payment and a 28 percent maximum “front-end” debt-to-income ratio. That required income is then compared to annualized average weekly wage data from the Bureau of Labor Statistics.
The Q2 2021 home affordability analysis reported that major ownership costs on median-priced homes in Q2 2021 consume less than 28 percent of average local wages in 57 percent of the U.S. counties analyzed. The report stated that among the 43 counties in the report with a population of at least 1 million, those where home ownership typically consumes less than 28 percent of average local wages in Q2 2021 include Wayne County (Detroit), MI (10.7 percent); Cuyahoga County (Cleveland), OH (12.9 percent); Philadelphia County, PA (18.1 percent); Harris County (Houston), TX (20.2 percent) and Franklin County (Columbus), OH (21 percent).
ATTOM’s latest home affordability report also states that among U.S. counties with a population of at least 1 million, those where home ownership consumes the highest percentage of average annualized local wages in Q2 2021, include Kings County (Brooklyn), NY (100.8 percent of annualized weekly wages needed to buy a home); Queens County, NY (68.7 percent); Nassau County, NY (outside New York City) (63 percent); Orange County, CA (outside Los Angeles) (59.2 percent) and Alameda County (Oakland), CA (54 percent).
Home Price Growth Vs Wage Growth
Also according to ATTOM’s Q2 2021 home affordability report, home-price appreciation is outpacing annualized wage growth in 72 percent of the U.S. counties analyzed, with the largest including Los Angeles County, CA; Harris County (Houston), TX; Maricopa County (Phoenix), AZ; San Diego County, CA, and Orange County, CA (outside Los Angeles).
The report notes that the average annualized wage growth is outpacing home-price appreciation in Q2 2021 in just 28 percent of the U.S. counties included in the analysis, including Cook County (Chicago), IL; Kings County (Brooklyn), NY; Bexar County (San Antonio), TX; Santa Clara County (San Jose), CA, and Wayne County (Detroit), MI.
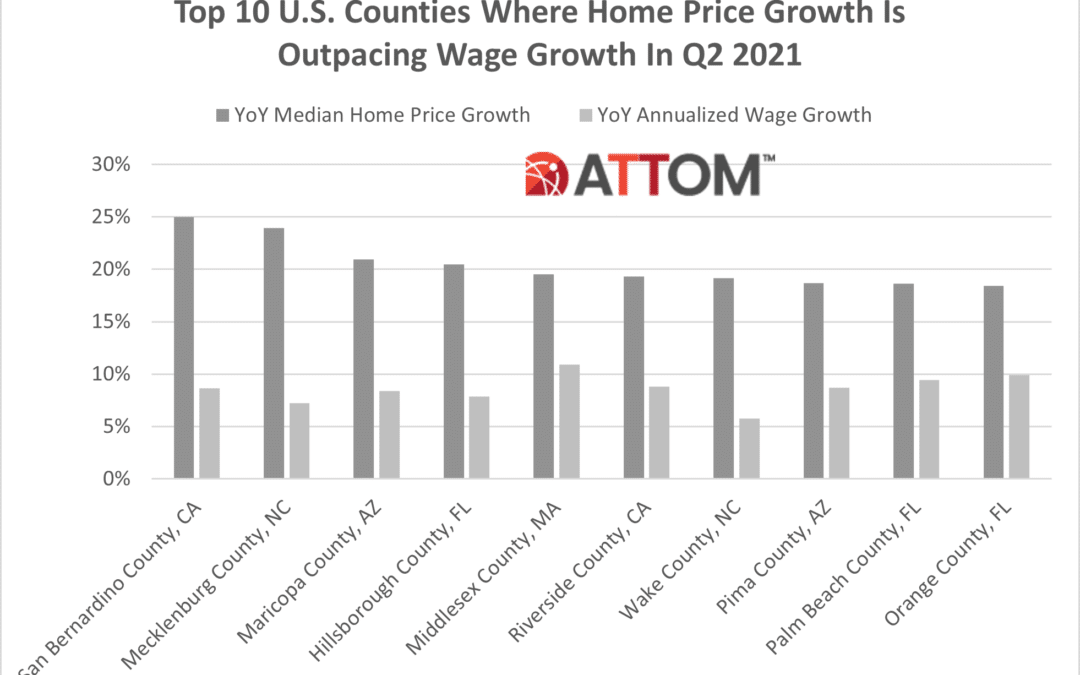
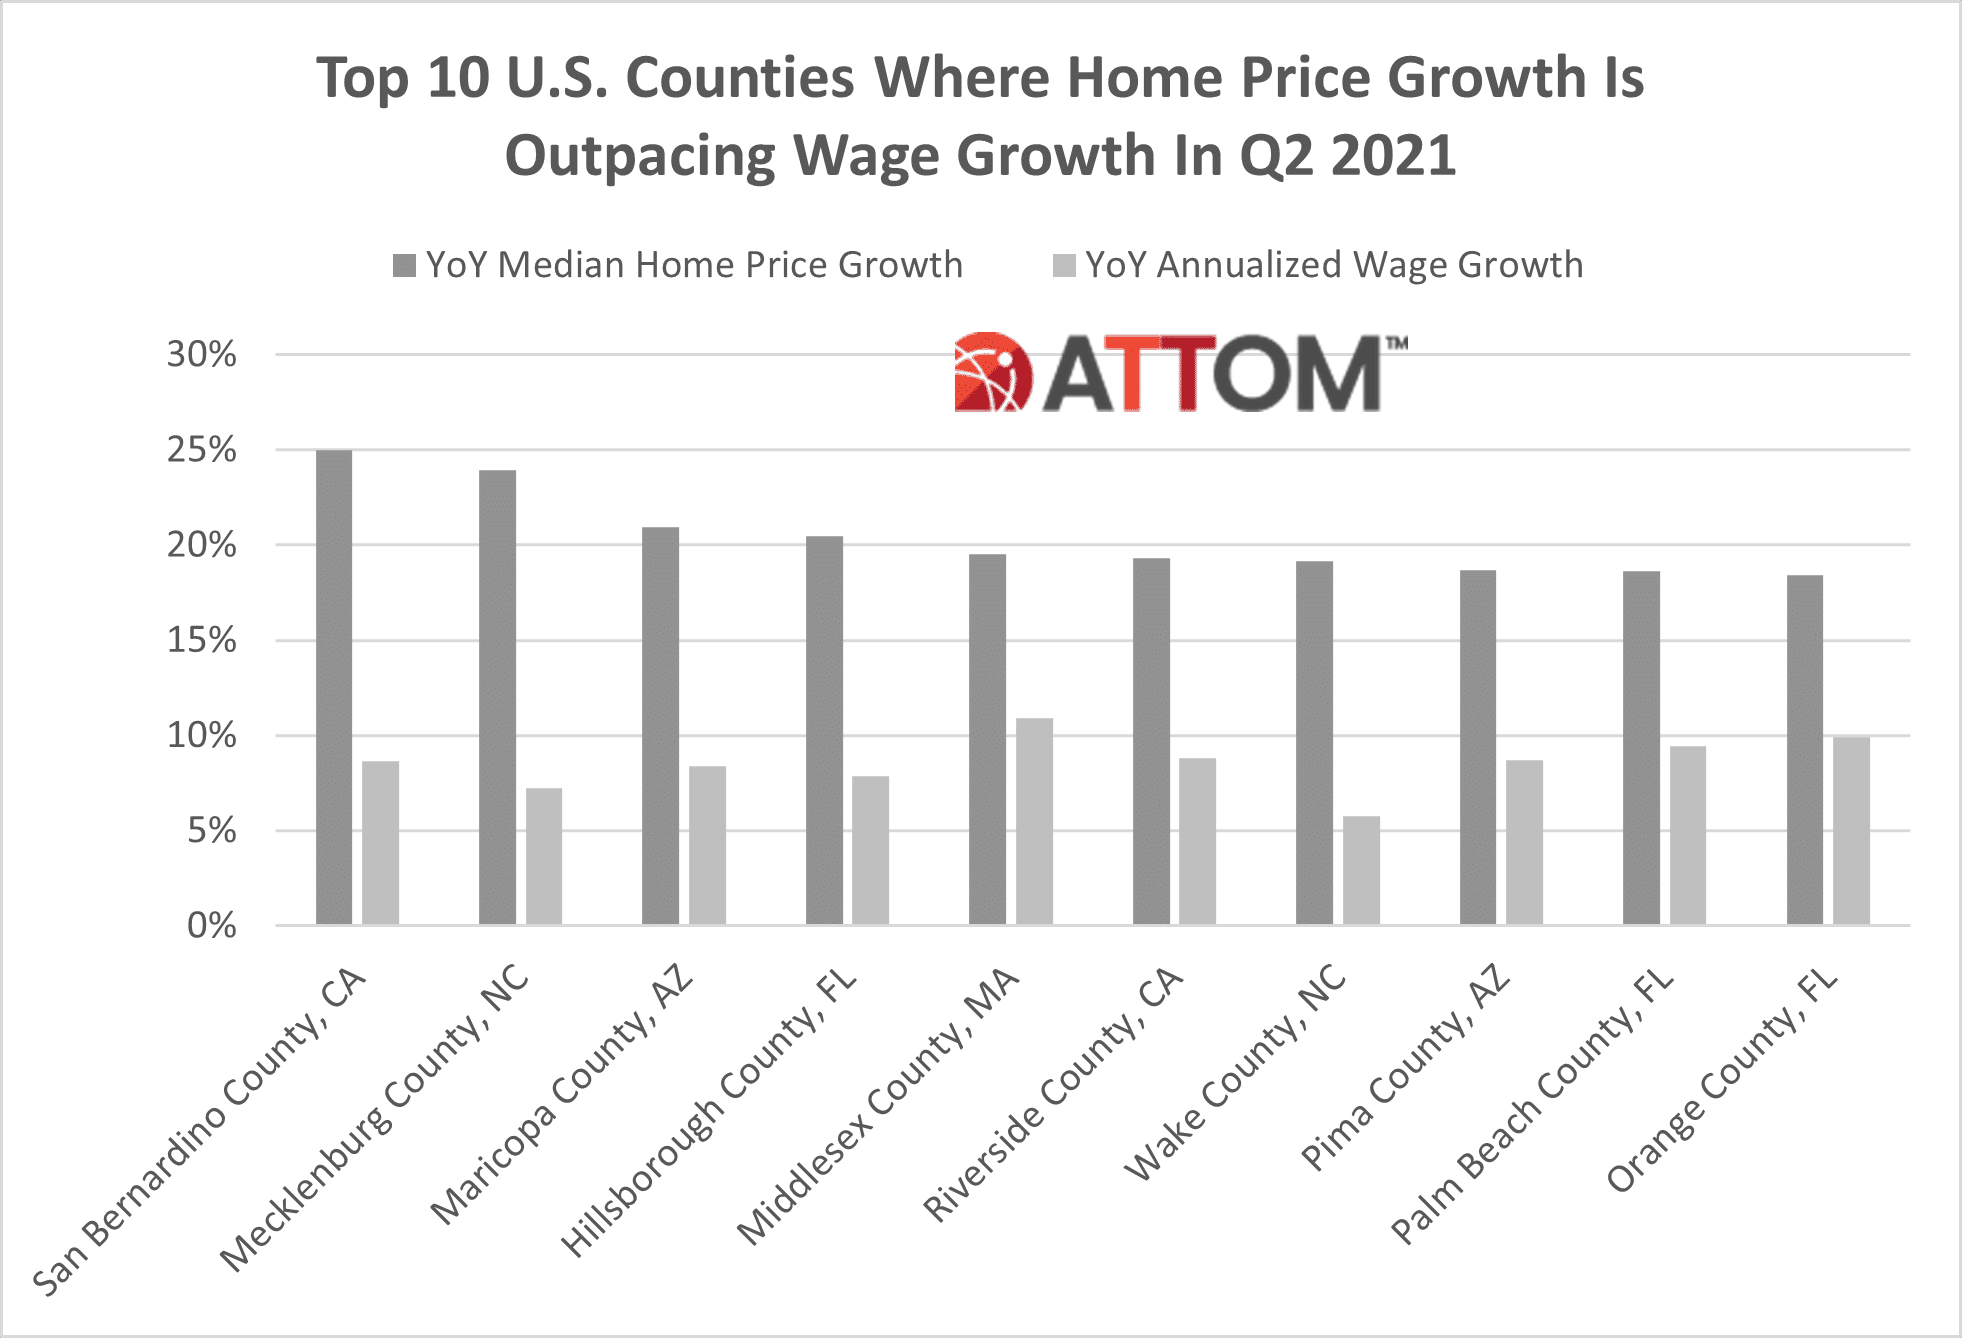
In this post, we take a deeper dive into the data behind the ATTOM Q2 2021 home affordability report to reveal the top 10 most populous counties where home price appreciation is outpacing wage growth. Among those counties with a population of 1 million or more, the top 10 where home price growth is outpacing wage growth include: San Bernardino County, CA (home prices up 25 percent); Mecklenburg County, NC (home prices up 24 percent); Maricopa County, AZ (home prices up 21 percent); Hillsborough County, FL (home prices up 20 percent); Middlesex County, MA (home prices up 20 percent); Riverside County, CA (home prices up 19 percent); Wake County, NC (home prices up 19 percent); Pima County, AZ (home prices up 19 percent); Palm Beach County, FL (home prices up 19 percent); and Orange County, FL (home prices up 18 percent).
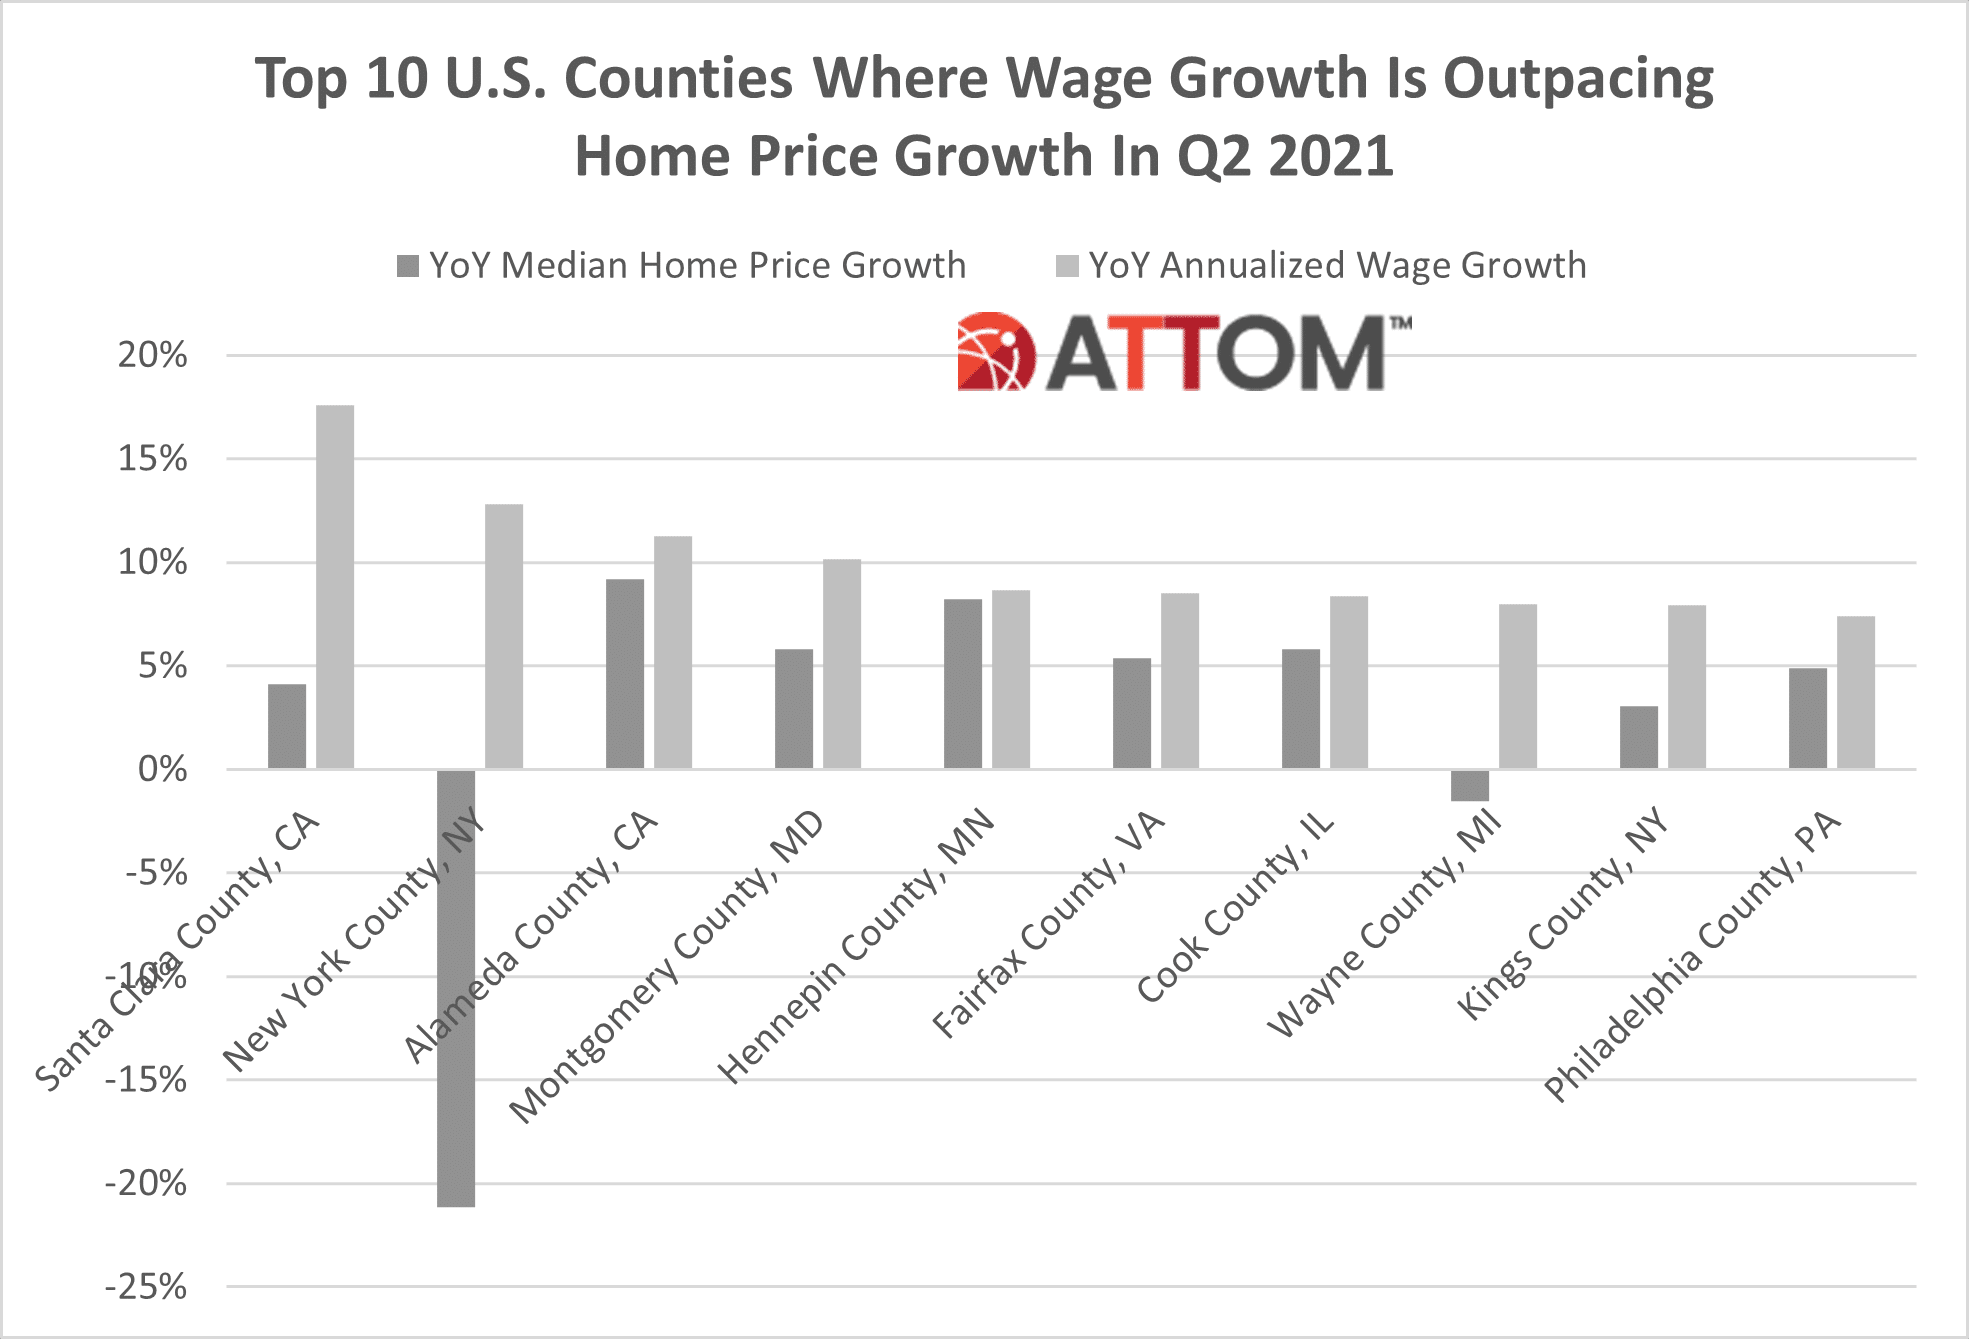
Also in this post, we dive deep into the data behind the ATTOM Q2 2021 home affordability report to reveal the top 10 most populous counties where wage growth is outpacing home price growth. Among those counties with a population of 1 million or more, the top 10 where wage growth is outpacing home price growth include: Santa Clara County, CA (wage growth up 18 percent); New York County, NY (wage growth up 13 percent); Alameda County, CA (wage growth up 11 percent); Montgomery County, MD (wage growth up 10 percent); Hennepin County, MN (wage growth up 9 percent); Fairfax County, VA (wage growth up 9 percent); Cook County, IL (wage growth up 8 percent); Wayne County, MI (wage growth up 8 percent); Kings County, NY (wage growth up 8 percent); and Philadelphia County, PA (wage growth up 7 percent).
Want to learn more about how home prices and wages are affecting home affordability in your area? Contact us to find out how!