
According to ATTOM’s just released Q3 2021 U.S. Home Flipping Report, single-family homes and condos flipped in the U.S. in the third quarter represented 5.7 percent of all home sales, or one in 18 transactions – up for the second quarter in a row after a year of declines.
ATTOM’s latest home flipping analysis notes the latest home flipping rate marked an increase from 5.1 percent, or one in every 20 home sales in the nation, in Q2 2021, and from 5.2 percent, or one in 19 sales, in Q3 2020.
The Q3 2021 home flipping report also notes that home flips as a portion of all home sales increased from Q2 2021 to Q3 2021 in 73 percent of the metro areas analyzed. Among those metros with a population of 200,000 or more and at least 50 home flips in Q3 2021, the largest home flipping rates were in Ogden, UT (flips comprised 9.5 percent of all home sales); Phoenix, AZ (9.5 percent); Salisbury, MD (9.3 percent); Salt Lake City, UT (9.3 percent) and Laredo, TX (9.2 percent).
Also according to ATTOM’s latest home flipping report, aside from Phoenix and Salt Lake City, the highest flipping rates in Q3 2021 among those metros with a population of 1 million or more were in Memphis, TN (9 percent); Oklahoma City, OK (8.8 percent) and Austin, TX (8.5 percent).
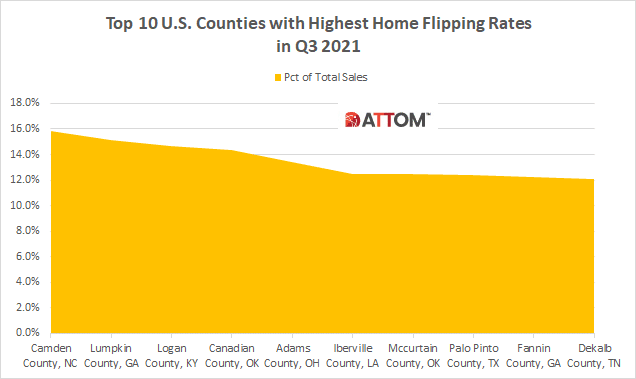
In this post, we dig deeper into the data behind the Q3 2021 home flipping analysis to uncover the top 10 U.S. counties with the highest home flipping rates in Q3 2021. Among counties with 10 or more home flips in Q3 2021, those counties with the highest home flipping rates included Camden County, NC (15.9 percent); Lumpkin County, GA (15.1 percent); Logan County, KY (14.7 percent); Canadian County, OK (14.4 percent); Adams County, OH (13.4 percent); Iberville County, LA (12.5 percent); Mccurtain County, OK (12.5 percent); Palo Pinto County, TX (12.4 percent); Fannin County, GA (12.2 percent); and Dekalb County, TN (12.1 percent).
ATTOM’s Q3 2021 home flipping report also states that home flippers who sold properties in Q3 2021 took an average of 147 days to complete the transactions, the smallest turnaround time since Q3 2010, and down from an average of 148 in Q2 2021 and 189 in Q3 2020.
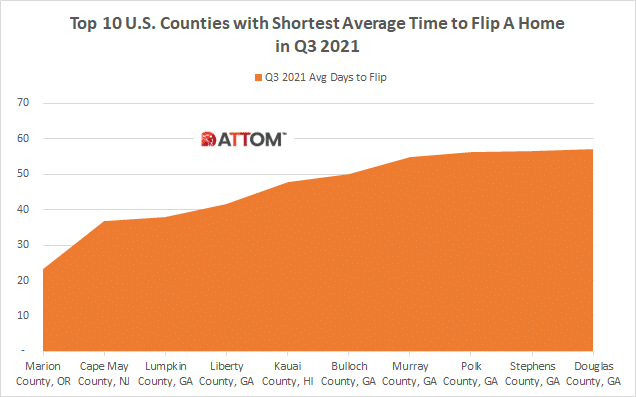
Also in this post, we dig deep into the data behind the Q3 2021 home flipping report to uncover those top U.S. counties with the shortest average time to flip a home. Among those counties with 10 or more home flips in Q3 2021, those counties with the shortest turnaround times to flip include Marion County, OR (23 Avg Days to Flip); Cape May County, NJ (37 days); Lumpkin County, GA (38 days); Liberty County, GA (42 days); Kauai County, HI (48 days); Bulloch County, GA (50 days); Murray County, GA (55 days); Polk County, GA (56 days); Stephens County, GA (57 days); and Douglas County, GA (57 days).
The Q3 2021 home flipping report notes that typical raw profits remained below where they were a year ago, and profit margins dipped to their lowest point since early 2011. Among all flips nationwide, the gross profit on typical transactions stood at $68,847 in Q3 2021. The report mentioned that while that was up 2.7 percent from $67,008 in Q2 2021, it was 1.6 percent less than the $70,000 level recorded in Q3 2020.
The report also mentioned that profit margins went down for the fourth quarter in a row, as the typical gross-flipping profit of $68,847 in Q3 2021 translated into just a 32.3 percent ROI compared to the original acquisition price. The reports also stated the national gross-flipping ROI was down from 33.2 percent in Q2 2021 and from 43.8 percent a year earlier, to its lowest point since Q1 2011.
Want to learn more about home flipping rates, profits or timelines in your area? Contact us to find out how!
