According to ATTOM’s new Q2 2022 Opportunity Zones Report, median single-family home and condo prices rose from Q1 2022 to Q2 2022 in 63 percent of Opportunity Zones analyzed, and went up at least 5 percent in roughly half of them. The report noted that typical values also shot up at least 20 percent annually in about half the zones analyzed.
ATTOM’s latest opportunity zones analysis looked at 5,198 zones around the U.S. with sufficient data to analyze, meaning they had at least five home sales in Q2 2022. The report noted that median values increased in about half the qualified zones by more than the 8.8 percent quarterly and 15.3 percent year-over-year gain seen for all markets nationwide in the Spring of 2022.
The Q2 2022 opportunity zones report also noted that typical home values in Opportunity Zones remained lower than those in most other neighborhoods around the nation, as median second-quarter prices fell below the national median of $346,000 in 77 percent of qualified zones.
Also according to the report, median prices also were under $200,000 in 49 percent of the zones in Q2 2022, but that percentage was down from 58 percent in Q2 2021 and 52 percent in Q1 2022.
The report mentioned that among states that had at least 25 Opportunity Zones with enough data to analyze in Q2 2022, those with the largest portion of zones where median prices rose year over year were in the West and were led by Utah (median prices up, year over year, in 97 percent of zones), Arizona (93 percent), Nevada (93 percent), Oregon (89 percent) and Idaho (88 percent).
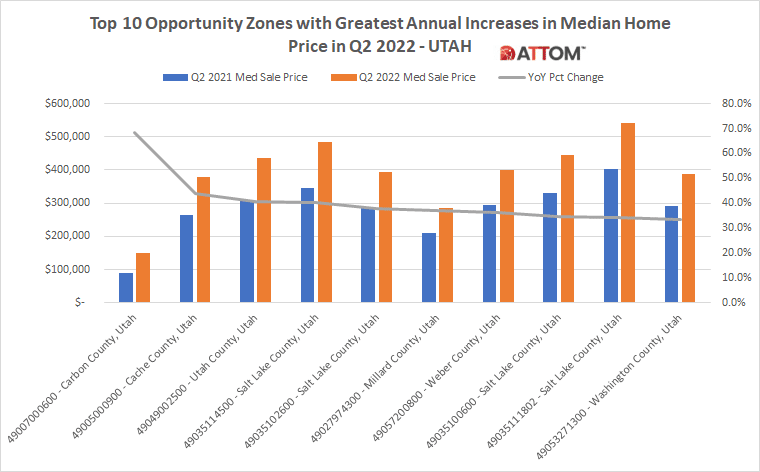
In this post, we dig into the data to uncover the top 10 opportunity zones among those top states with the highest concentrations of qualified zones where the median prices rose year-over-year.
For Utah, those zones include: 49007000600 – Carbon County, Utah (68.5 percent increase); 49005000900 – Cache County, Utah (43.8 percent increase); 49049002500 – Utah County, Utah (40.6 percent increase); 49035114500 – Salt Lake County, Utah (40.2 percent increase); 49035102600 – Salt Lake County, Utah (37.6 percent increase); 49027974300 – Millard County, Utah (36.9 percent increase); 49057200800 – Weber County, Utah (36.3 percent increase); 49035100600 – Salt Lake County, Utah (34.7 percent increase); 49035111802 – Salt Lake County, Utah (34.1 percent increase); and 49053271300 – Washington County, Utah (33.5 percent increase).
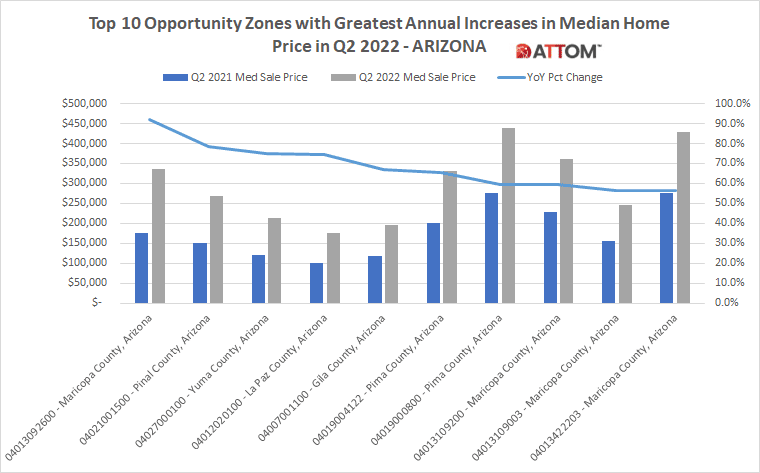
For Arizona, those zones include: 04013092600 – Maricopa County, Arizona (92.0 percent increase); 04021001500 – Pinal County, Arizona (78.5 percent increase); 04027000100 – Yuma County, Arizona (75.0 percent increase); 04012020100 – La Paz County, Arizona (74.7 percent increase); 04007001100 – Gila County, Arizona (67.1 percent increase); 04019004122 – Pima County, Arizona (65.6 percent increase); 04019000800 – Pima County, Arizona (59.4 percent increase); 04013109200 – Maricopa County, Arizona (59.2 percent increase); 04013109003 – Maricopa County, Arizona (56.5 percent increase); and 04013422203 – Maricopa County, Arizona (56.3 percent increase).
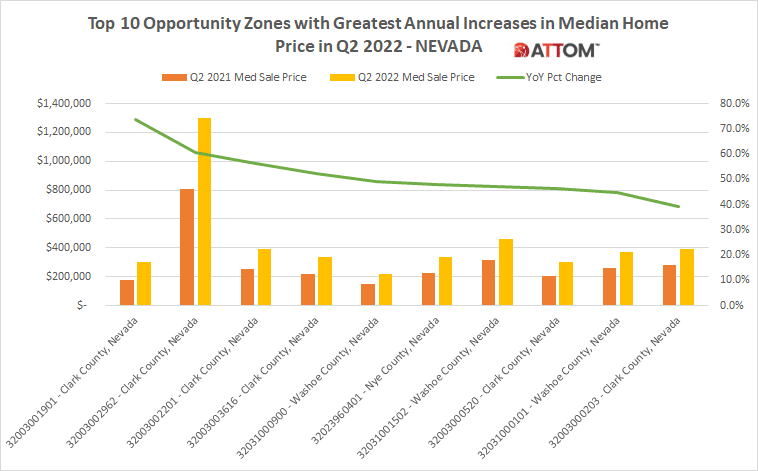
For Nevada, those zones include: 32003001901 – Clark County, Nevada (73.8 percent increase); 32003002962 – Clark County, Nevada (60.5 percent increase); 32003002201 – Clark County, Nevada (56.4 percent increase); 32003003616 – Clark County, Nevada (52.3 percent increase); 32031000900 – Washoe County, Nevada (49.2 percent increase); 32023960401 – Nye County, Nevada (47.9 percent increase); 32031001502 – Washoe County, Nevada (47.0 percent increase); 32003000520 – Clark County, Nevada (46.3 percent increase); 32031000101 – Washoe County, Nevada (44.9 percent increase); and 32003000203 – Clark County, Nevada (39.3 percent increase).
For Oregon, those zones include: 41035971800 – Klamath County, Oregon (61.3 percent increase); 41007950300 – Clatsop County, Oregon (51.9 percent increase); 41011000504 – Coos County, Oregon (39.1 percent increase); 41015950100 – Curry County, Oregon (37.8 percent increase); 41059950200 – Umatilla County, Oregon (36.6 percent increase); 41045970500 – Malheur County, Oregon (35.3 percent increase); 41047010303 – Marion County, Oregon (34.4 percent increase); 41047001000 – Marion County, Oregon (33.3 percent increase); 41039003600 – Lane County, Oregon (30.4 percent increase); and 41065970500 – Wasco County, Oregon (29.3 percent increase)

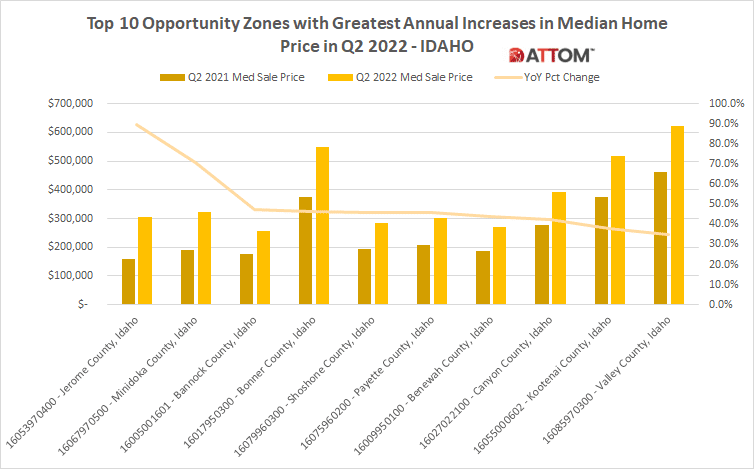
For Idaho, those zones include: 16053970400 – Jerome County, Idaho (89.8 percent increase); 16067970500 – Minidoka County, Idaho (70.6 percent increase); 16005001601 – Bannock County, Idaho (47.5 percent increase); 16017950300 – Bonner County, Idaho (46.4 percent increase); 16079960300 – Shoshone County, Idaho (45.9 percent increase); 16075960200 – Payette County, Idaho (45.6 percent increase); 16009950100 – Benewah County, Idaho (44.1 percent increase); 16027022100 – Canyon County, Idaho (42.2 percent increase); 16055000602 – Kootenai County, Idaho (38.0 percent increase); and 16085970300 – Valley County, Idaho (34.7 percent increase).
ATTOM’s Q2 2022 opportunity zones report looks at those zones defined in the Tax Act legislation as census tracts in or alongside low-income neighborhoods that meet various criteria for redevelopment in all 50 states, the District of Columbia and U.S. territories. Census tracts, as defined by the U.S. Census Bureau, cover areas that have 1,200 to 8,000 residents, with an average of about 4,000 people.
Want to learn more about opportunity zones in your area? Contact us to find out how!