ATTOM Data Solutions’ just released Q3 2020 U.S. Home Sales Report reveals that both the raw-profit and return-on-investment figures recorded from the typical home sale in the U.S. in third quarter of 2020, stand at the highest points since the U.S. economy began recovering from the Great Recession in 2012.
According to ATTOM’s latest home sales analysis, this record high represents a continued increase even as the Coronavirus pandemic has damaged the economy and led to spikes in unemployment throughout the country this year.
ATTOM’s Q3 2020 home sales report notes the typical home sale during the third quarter in the U.S. generated a gain of $85,000, up from $75,000 in Q2 2020 and $66,000 in Q3 2019. The report states the typical $85,000 home-sale profit represented a 38.6 percent return on investment compared to the original purchase price. That number is up from 37.5 percent in Q2 2020 and 33.7 percent in Q3 2019.
The Q3 2020 home sales analysis also states the typical profit margins – the percent change between median purchase and resale prices – rose from Q3 2019 to Q3 2020 in 86 percent (89 of 103) of the U.S. metro areas with at least 1,000 single-family home and condo sales in Q3 2020.
According to the report, the metros with the biggest annual increases in profit margins were St. Louis, MO (margin up from 22.4 percent to 37.1 percent); Columbus, OH (up from 37.1 percent to 51.6 percent); Salem, OR (up from 60.6 percent to 73.9 percent); Indianapolis, IN (up from 32.7 percent to 46 percent) and Akron, OH (up from 20.7 percent to 33.7 percent).
The Q3 2020 home sales report noted that aside from Columbus, St. Louis and Indianapolis, the biggest increases in metro areas with a population of at least 1 million were in Cleveland, OH (up from 20 percent to 32.8 percent) and Kansas City, MO (up from 35.7 percent to 47.3 percent).
Largest Annual Increases in Raw Profits
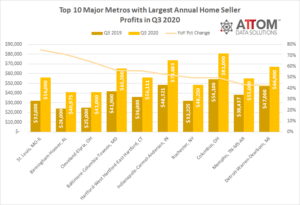
In this post, we dive deeper into the data behind the Q3 2020 home sales analysis to uncover the major metros with the largest annual increases in raw profits. Those top 10 areas with a population of at least 1 million and at least 1,000 single-family home and condo sales in Q3 2020, include: St. Louis, MO-IL (profit increased from $32,000 to $56,000); Birmingham-Hoover, AL (increased from $24,000 to $40,975); Cleveland-Elyria, OH (increased from $25,000 to $41,000); Baltimore-Columbia-Towson, MD (increased from $41,900 to $65,500); Hartford-West Hartford-East Hartford, CT (increased from $36,000 to $56,111); Indianapolis-Carmel-Anderson, IN (increased from $48,321 to $73,683); Rochester, NY (increased from $32,225 to $48,250); Columbus, OH (increased from $54,100 to $81,000); Memphis, TN-MS-AR (increased from $38,437 to $55,000); and Detroit-Warren-Dearborn, MI (increased from $47,000 to $66,900).
ATTOM’s latest home sales report also noted that the West continues to have the largest profit margins in the country, with 14 of the top 15 typical home-sale returns on investment in Q3 2020, from among the 103 metropolitan statistical areas with enough data to analyze. Those metros were led by San Jose, CA (89 percent return); Salem, OR (73.9 percent); Seattle, WA (73 percent); Spokane, WA (70.3 percent) and Salt Lake City, UT (65.1 percent).
Largest Home Seller Dollar Gains
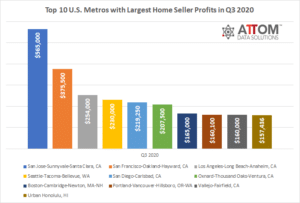
In terms of the largest raw profits, in this post we also unveil the top 10 U.S. metros that saw the greatest home seller dollar gains in Q3 2020. Those areas included San Jose-Sunnyvale-Santa Clara, CA ($565,000); San Francisco-Oakland-Hayward, CA ($375,500); Los Angeles-Long Beach-Anaheim, CA ($254,000); Seattle-Tacoma-Bellevue, WA ($230,000); San Diego-Carlsbad, CA ($219,250); Oxnard-Thousand Oaks-Ventura, CA ($207,500); Boston-Cambridge-Newton, MA-NH ($165,000); Portland-Vancouver-Hillsboro, OR-WA ($160,100); Vallejo-Fairfield, CA ($160,000); and Urban Honolulu, HI ($157,436).
ATTOM’s Q3 2020 home sales analysis also reported that every major metro area saw home values rise during the third quarter of 2020. The reported noted the biggest year-over-year increases in median home prices in Q3 2020 were seen in the metro areas of Bridgeport, CT (up 29.7 percent); Detroit, MI (up 27.4 percent); New Haven, CT (up 20.1 percent); Birmingham, AL (up 19.7 percent) and Indianapolis, IN (up 19.3 percent).
Want to learn more about how home sales are trending in your area? Contact us to find out how!


