
Profit Margins Hit New Highs Even as Coronavirus Pandemic Damages National Economy; Margins Increase in Almost 90 Percent of Markets Across Nation; Median Home Prices Rise In Every Major Market
IRVINE, Calif. – Oct. 22, 2020 — ATTOM Data Solutions, curator of the nation’s premier property database and first property data provider of Data-as-a-Service (DaaS), today released its third-quarter 2020 U.S. Home Sales Report, which shows that profits for home sellers nationwide continue to hit high points despite the economic distress caused by the worldwide Coronavirus pandemic.
The report reveals that the typical third-quarter 2020 home sale in the United States generated a gain of $85,000, up from $75,000 in the second quarter of 2020 and $66,000 in the third quarter of last year. The typical $85,000 home-sale profit represented a 38.6 percent return on investment compared to the original purchase price, up from 37.5 percent in the second quarter of 2020 and up from 33.7 percent a year ago.
Both the raw-profit and return-on-investment figures stood at the highest points since the U.S. economy began recovering from the Great Recession in 2012, and represents a continued increase even as the Coronavirus pandemic has damaged the economy and led to spikes in unemployment throughout the country this year.
“Home prices and seller profits across the nation continue racking up new highs as the housing market remains relatively immune from the economic havoc caused by the Coronavirus pandemic. It’s almost as if the housing market and the overall economy are operating in different worlds,” said Todd Teta, chief product officer at ATTOM Data Solutions. “Things remain in flux, given the significant uncertainty about when the pandemic might recede or what impact the recent resurgence could have in different areas of the country. But with mortgage rates at rock-bottom levels and declining supplies of homes for sale, conditions remain in place for continued strong prices and returns.”
Profit margins climb in nearly nine of every 10 major metro area
Typical profit margins – the percent change between median purchase and resale prices – rose from the third quarter of 2019 to the third quarter of 2020 in 89 (86 percent) of 103 metropolitan statistical areas around the United States with sufficient data to analyze. Metro areas were included if they had at least 1,000 single-family home and condo sales in the third quarter of 2020.
The biggest annual increases in profit margins came in the metro areas of St. Louis, MO (margin up from 22.4 percent to 37.1 percent); Columbus, OH (up from 37.1 percent to 51.6 percent); Salem, OR (up from 60.6 percent to 73.9 percent); Indianapolis, IN (up from 32.7 percent to 46 percent) and Akron, OH (up from 20.7 percent to 33.7 percent).
Aside from Columbus, St. Louis and Indianapolis, the biggest increases in metro areas with a population of at least 1 million were in Cleveland, OH (up from 20 percent to 32.8 percent) and Kansas City, MO (up from 35.7 percent to 47.3 percent).
Profit margins dropped in just 14 of the 103 metro areas analyzed (14 percent). The biggest decreases were in Honolulu, HI (down from 43.9 percent to 35.1 percent); San Francisco, CA (down from 71.3 percent to 64.5 percent); Fort Collins, CO (down from 49.3 percent to 43.7 percent); Miami, FL (down from 46.8 percent to 41.6 percent) and Las Vegas, NV (down from 47.3 percent to 42.9 percent).
The biggest decreases in metro areas with a population of at least 1 million, aside from San Francisco, Miami and Las Vegas, were in Pittsburgh, PA (down from 32.1 percent to 28.8 percent) and Denver, CO (down from 47.6 percent to 45.6 percent).
Profit margins remain highest in western markets
The West continues to have the largest profit margins in the country, with 14 of the top 15 typical home-sale returns on investment in the third quarter, from among the 103 metropolitan statistical areas with enough data to analyze. They were led by San Jose, CA (89 percent return); Salem, OR (73.9 percent); Seattle, WA (73 percent); Spokane, WA (70.3 percent) and Salt Lake City, UT (65.1 percent).
Eleven of the 15 smallest margins were in the Southern region. The lowest were in El Paso, TX (12 percent); Little Rock, AR (12.3 percent); Baton Rouge, LA (13.9 percent); Columbia, SC (15.7 percent) and Virginia Beach, VA (16.7 percent).
Every major metro area sees home values rise
Despite the economic fallout from the Coronavirus pandemic, median home prices in the third quarter of 2020 continue to rise across the nation.
The biggest year-over-year increases in median home prices during the third quarter of 2020 came in the metro areas of Bridgeport, CT (up 29.7 percent); Detroit, MI (up 27.4 percent); New Haven, CT (up 20.1 percent); Birmingham, AL (up 19.7 percent) and Indianapolis, IN (up 19.3 percent).
Along with Detroit, Indianapolis and Birmingham, major metro areas with a population of at least 1 million and more than a 15 percent annual increase in home prices in the third quarter of 2020 included Columbus, OH (up 19 percent); St. Louis, MO (up 18.3 percent); Seattle, WA (up 17.2 percent); Phoenix, AZ (up 16.7 percent) and Virginia Beach, VA (up 16.7 percent).
Home prices in the third quarter of 2020 hit or tied with new peaks in 95 percent of the metro areas in the report, including New York, NY; Los Angeles, CA; Chicago, IL; Dallas, TX and Houston, TX.
The smallest year-over-year increases in median prices during the third quarter were in Honolulu, HI (up 1.7 percent); New York, NY (up 4.9 percent); Pittsburgh, PA (up 6.1 percent); Dayton, OH (up 6.2 percent) and Fort Collins, CO (up 6.6 percent).
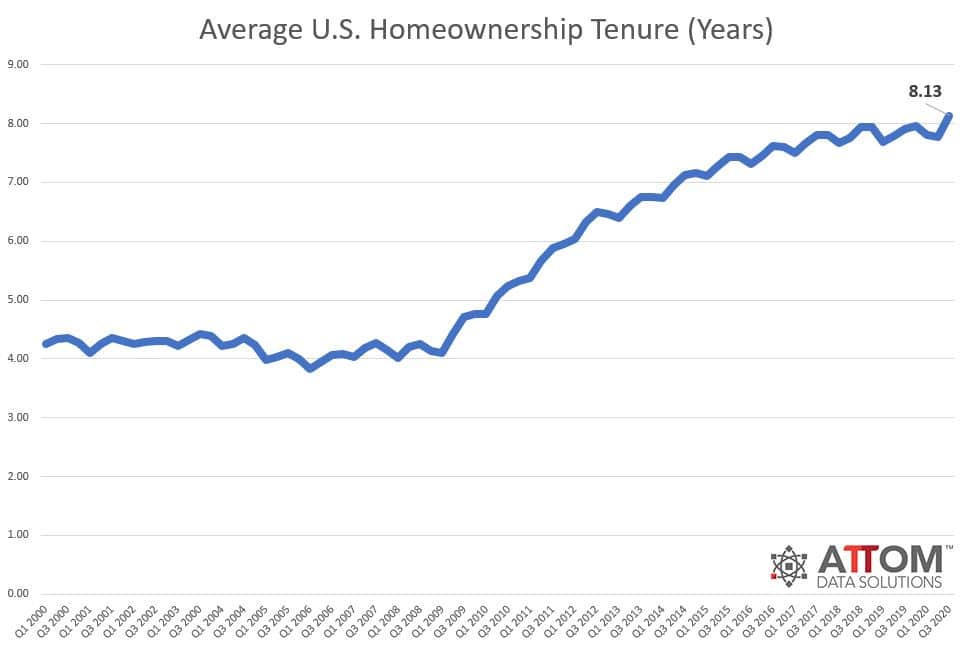
Homeownership tenure also hits new high nationwide
Homeowners who sold in the third quarter of 2020 had owned their homes an average of 8.13 years – a new high since 2000 – up from 7.76 years in the previous quarter and from 7.91 years in the third quarter of 2019.
Among metro areas with sufficient data, 72 percent saw increases in average tenure from the second quarter of 2020 to the third quarter of 2020. They were led by Detroit, MI (up 14 percent); Springfield, MA (up 11 percent); Colorado Springs, CO (up 10 percent); Memphis, TN (up 9 percent) and Bellingham, WA (up 8 percent).
The 30 longest average tenures in the third quarter of 2020 were all on the east or west coasts, led by Bridgeport, CT (12.69 years); Torrington, CT (12.65 years); Norwich, CT (12.42 years); New Haven, CT (12.33 years) and Springfield, MA (12.21 years).
Average U.S. Homeownership Tenure
The smallest tenures during the third quarter of 2020 were in Oklahoma City, OK (6.56 years); Colorado Springs, CO (6.86 years); Provo, UT (6.96 years); San Antonio, TX (7.06 years) and Austin, TX (7.06 years).
Cash sales remain low in third quarter
Nationwide, all-cash purchases accounted for 21.6 percent of single-family home and condo sales in the third quarter of 2020, the second lowest level since 2007. The third-quarter number was up from the 20.5 percent in the second quarter of 2020, but down from 24 percent in the third quarter of 2019.
Among metropolitan statistical areas with a population of at least 200,000 and sufficient cash-sales data, those where cash sales represented the smallest share of all transactions in the third quarter of 2020 included Vallejo, CA (9.8 percent); Kennewick, WA (10.3 percent); Olympia, WA (12.5 percent); Virginia Beach, VA (12.8 percent) and Washington, DC (13 percent).
Among those metros where cash sales represented the largest shares, were Ocala, FL (40.4 percent of sales); Sarasota, FL (37 percent); Winston-Salem, NC (35.5 percent); Miami, FL (32.9 percent) and Augusta, GA (32.7 percent).
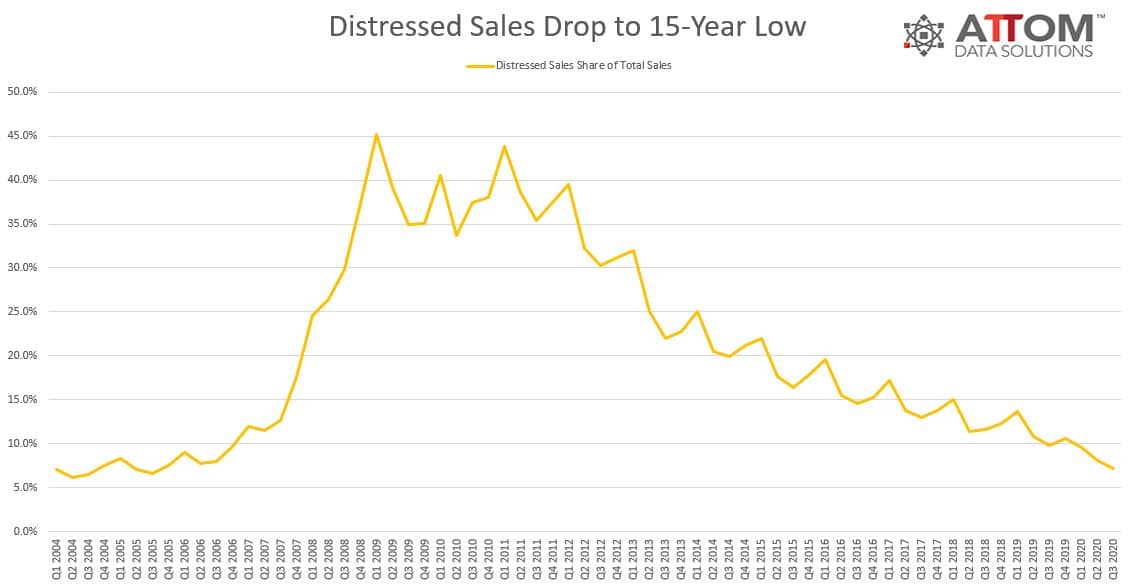
U.S. distressed sales at 15-year low
Distressed home sales — including bank-owned (REO) sales, third-party foreclosure auction sales and short sales — accounted for 7.2 percent of all U.S. single-family home and condo sales in the third quarter of 2020, down from 8.1 percent in the prior quarter and down from 9.8 percent in the third quarter of 2019. The latest figure marks the lowest point since the third quarter of 2005 and is less than one-sixth of the peak level of 45.2 percent in first quarter of 2009.
Among metropolitan statistical areas with a population of at least 200,000 and sufficient data, those where distressed sales represented the largest portion of all sales in the third quarter of 2020 included Columbus, GA (18.3 percent of sales); Chico, CA (17.9 percent); Macon, GA (15.9 percent); Montgomery, AL (15.9 percent) and Peoria, IL (14.8 percent).
Metro areas with a population of at least 1 million that had the highest levels of distressed sales in the third quarter of 2020 were Hartford, CT (13.3 percent of sales); Providence, RI (12.9 percent); Baltimore, MD (12.6 percent); Cleveland, OH (12.3 percent) and Chicago, IL (11.7 percent).
Metro areas with a population of at least 1 million where distressed sales made up the smallest portion of all sales in the third quarter were Austin, TX (2.5 percent); San Jose, CA (2.6 percent); Seattle, WA (2.6 percent); San Francisco, CA (3 percent) and San Diego, CA (3.5 percent).
States where distressed sales comprised the largest portion of total sales in the third quarter of 2020 were Connecticut (13.7 percent of all sales), Rhode Island (13.3 percent), Illinois (12.2 percent), New Jersey (12 percent) and Delaware (11.8 percent).
Counter to the national trend, the share of sales represented by properties in distress increased annually in the third quarter of 2020 in seven states with enough data to analyze, led by Iowa (up from 6.4 percent to 8.7 percent), Kentucky (up from 6.9 percent to 8.9 percent), West Virginia (up from 8.1 percent to 9.2 percent), Minnesota (up from 5.1 percent to 5.7 percent) and Nebraska (up from 8.3 percent to 9 percent).
The biggest rates of decline were in Washington (down from 6.3 percent to 2.8 percent), Nevada (down from 13.8 percent to 6.7 percent), Texas (down from 8.6 percent to 4.3 percent), Arizona (down from 11.5 percent to 6.4 percent) and Oregon (down from 6.8 percent to 4 percent).
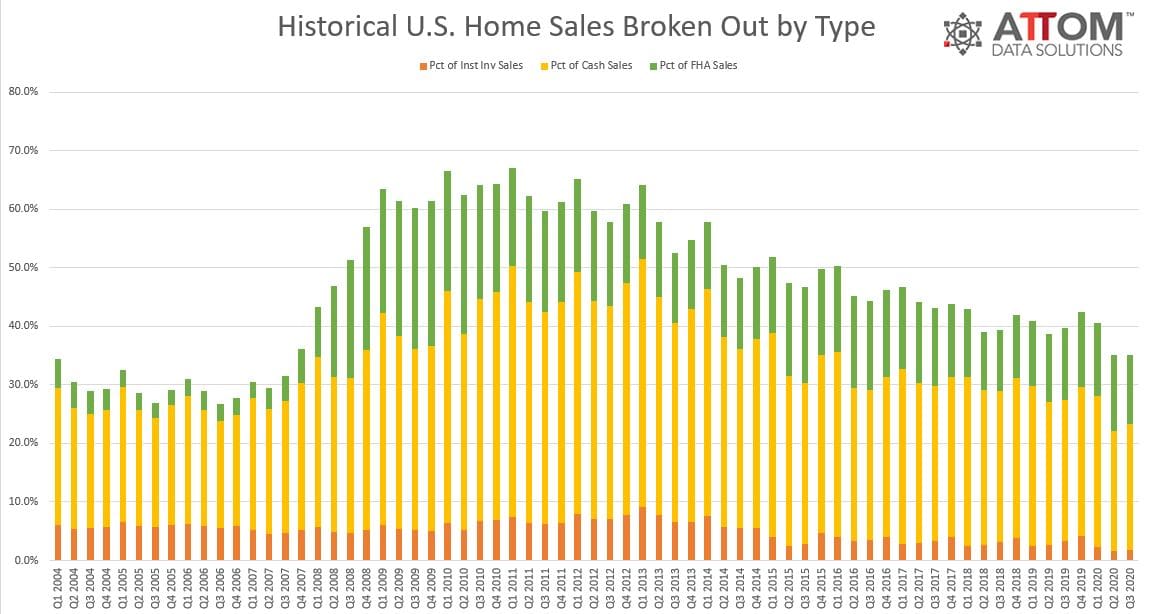
Institutional investing remains near 20-year low
Institutional investors nationwide accounted for just 1.7 percent of all single-family home and condo sales in the third quarter of 2020, up from the 20-year low point of 1.6 percent in the second quarter of 2020, but down from 3.4 percent in the third quarter of 2019.
Among states with enough data to analyze, those with the smallest percentages of sales by institutional investors in the third quarter of 2020 were Connecticut (0.5 percent of sales), New Jersey (0.6 percent), Oregon (0.7 percent), Utah (0.7 percent) and Virginia (0.8 percent).
States with the largest levels of sales by institutional investors in the third quarter of 2020 were Arizona (3.7 percent of sales), Georgia (3.6 percent), Nebraska (3.3 percent), Oklahoma (3.1 percent) and Alabama (2.9 percent).
Historical U.S. Home Sales Broken Out by Type Chart
Texas metro areas continue to have high levels of FHA loans
Nationwide, buyers using Federal Housing Administration (FHA) loans accounted for 11.8 percent of all single-family home and condo purchases in the third quarter of 2020, down from 13 percent in the previous quarter and from 12.2 percent a year ago.
Among metropolitan statistical areas with a population of at least 200,000 and sufficient FHA-buyer data, those with the highest share of FHA buyers in the third quarter of 2020 were McAllen, TX (33.1 percent of sales); Beaumont, TX (28.5 percent); El Paso, TX (28.1 percent); Yuma, AZ (26.3 percent) and Merced, CA (26.1 percent).
###
Report methodology
The ATTOM Data Solutions U.S. Home Sales Report provides percentages of distressed sales and all sales that are sold to investors, institutional investors and cash buyers, a state and metropolitan statistical area. Data is also available at the county and zip code level upon request. The data is derived from recorded sales deeds, foreclosure filings and loan data. Statistics for previous quarters are revised when each new report is issued as more deed data becomes available.
Definitions
All-cash purchase: sale where no loan is recorded at the time of sale and where ATTOM has coverage of loan data.
Homeownership tenure: for a given market and given quarter, the average time between the most recent sale date and the previous sale date, expressed in years.
Home seller price gains: the difference between the median sales price of homes in a given market in a given quarter and the median sales price of the previous sale of those same homes, expressed both in a dollar amount and as a percentage of the previous median sales price.
Institutional investor purchases: residential property sales to non-lending entities that purchased at least 10 properties in a calendar year.
REO sale: a sale of a property that occurs while the property is actively bank owned (REO).
Short sale: a sale of a property where the sale price is less than (short) the combined amount of loans secured by the property.
Third-party foreclosure auction sale: a sale of a property that occurs at the public foreclosure auction (trustee’s sale or sheriff’s sale) in which the property is sold to a third-party buyer and does not transfer back to the foreclosing bank.
About ATTOM Data Solutions
ATTOM Data Solutions provides premium property data to power products that improve transparency, innovation, efficiency and disruption in a data-driven economy. ATTOM multi-sources property tax, deed, mortgage, foreclosure, environmental risk, natural hazard, and neighborhood data for more than 155 million U.S. residential and commercial properties covering 99 percent of the nation’s population. A rigorous data management process involving more than 20 steps validates, standardizes and enhances the data collected by ATTOM, assigning each property record with a persistent, unique ID — the ATTOM ID. The 9TB ATTOM Data Warehouse fuels innovation in many industries including mortgage, real estate, insurance, marketing, government and more through flexible data delivery solutions that include bulk file licenses, property data APIs, real estate market trends, marketing lists, match & append and introducing the first property data delivery solution, a cloud-based data platform that streamlines data management – Data-as-a-Service (DaaS).
Media Contact:
Christine Stricker
949.748.8428
christine.stricker@attomdata.com
Data and Report Licensing:
949.502.8313
