This post was updated Dec. 18, 2017, to reflect final updates to the bill, most notably the change in the cap for the mortgage interest rate deduction from $500,000 to $750,000.
The Republican tax proposal unveiled last week includes two changes to the income tax structure that could potentially have significant impacts on homeowners, and by extension the housing market.
We’ve created two heat maps to illustrate which local housing markets could have the most homeowners impacted by these changes. For a detailed local property tax analysis, click here.
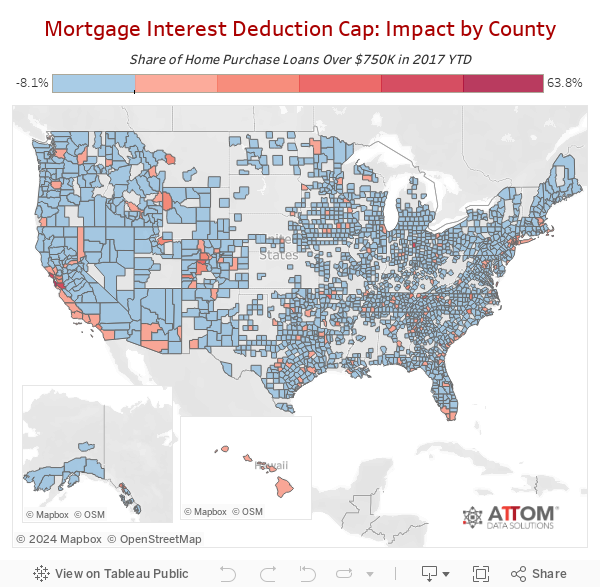
Counties most impacted by reduced mortgage interest rate deduction
The first proposed change involves the mortgage interest rate deduction, often touted by many in the industry as an icing-on-the-cake advantage of homeownership. The proposal calls for a reduction in the amount of mortgage interest that can be claimed as a deduction for federal income taxes. Now, homeowners can deduct interest paid on up to $1 million worth of home loans, but under the GOP proposal, homeowners would only be able to deduct interest paid on up to $750,000 worth of home loans.
Nationwide, nearly 99,000 single family home and condo purchases so far in 2017 have involved a mortgage higher than $750,000. That represents 3.9 percent of all home purchase loans so far in the year. The county-level heat map below shows the percentage of home purchase loan originations so far in 2017 where the loan amount was above $750,000 in each county, providing a ballpark estimate of what share of the housing market would be affected if this portion of the tax plan is enacted.
Among 2,022 counties included in this analysis and at least 50 home purchase loans so far in 2017, those with the highest share of loan originations above $750,000 were New York County (Manhattan), New York (63.8 percent); San Francisco County, California (58.0 percent); Nantucket County, Massachusetts (57.3 percent); San Mateo County, California (55.2 percent); and Marin County, California (50.o percent). Among those same 2,022 counties, those with the highest number of purchase home loan originations above $750,000 so far in 2017 were Los Angeles County, California (9,197); Santa Clara County, California (5,543); Orange County, California (4,450); Maricopa County, Arizona (3,723); and King County, Washington (3,715).
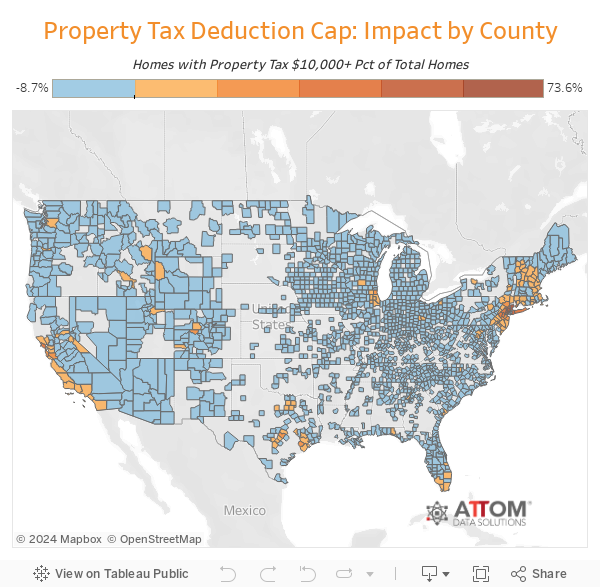
Counties most impacted by cap on property tax deduction
The second proposed change in the GOP proposed income tax plan that impacts homeowners is a new cap on how much homeowners can deduct for property taxes. Under the proposal, homeowners can only deduct up to $10,000 in property taxes from their federal income taxes.
The county-level heat map below shows the share of single family homes and condos in each county where the most recent property tax bill available was more than $10,000.
Among the 1,731 counties analyzed, those with the highest share of homes with property taxes above $10,000 were Westchester County, New York (73.4 percent); Luna County, New Mexico (68.7 percent); Rockland County, New York (60.0 percent); Mathews County, Virginia (54.4 percent); and New York County (Manhattan), New York (52.5 percent). Among those same counties those with the highest volume of homes with property taxes above $10,000 were Nassau County (Long Island), New York (176,946); Los Angeles County, California (165,078); Suffolk County (Long Island), New York (155,592); Bergen County, New Jersey (126,096); and Harris County (Houston), Texas (125,792).