
Up From 36 Percent of Markets Below Pre-Recession Levels a Year Ago
Markets Still Above Pre-Recession Levels Include New York, Chicago, Philadelphia
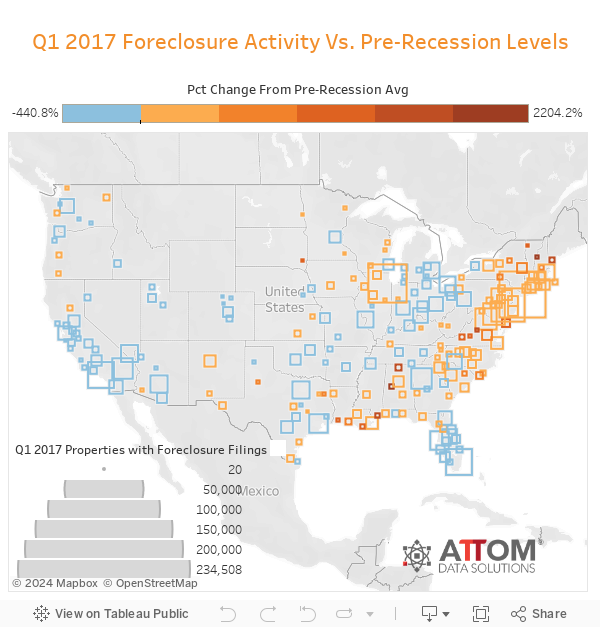
IRVINE, Calif. – April 13, 2017 – ATTOM Data Solutions, curator of the nation’s largest fused property database, today released its Q1 and March 2017 U.S. Foreclosure Market Report, which shows first quarter foreclosure activity was below pre-recession levels nationwide and in 102 out of 216 metropolitan statistical areas (47 percent) analyzed in the report.
Nationwide the report shows foreclosure filings — default notices, scheduled auctions and bank repossessions — were reported on 234,508 U.S. properties in the first quarter of 2017, down 11 percent from the previous quarter and down 19 percent from a year ago to the lowest level since Q3 2006. The first-quarter foreclosure activity total was 16 percent below the pre-recession average of 278,912 properties with foreclosure filings each quarter between Q1 2006 and Q3 2007.
“U.S. foreclosure activity on a quarterly basis first dipped below pre-recession averages in the fourth quarter of last year, and this report shows that trend continuing for the second consecutive quarter,” said Daren Blomquist, senior vice president with ATTOM Data Solutions. “The number of local markets dropping below pre-recession levels continues to grow, up from 78 a year ago to 102 in this report.”
Markets below pre-recession levels include Los Angeles, Dallas, Houston
The 102 local markets with first quarter foreclosure activity below pre-recession averages included Los Angeles (46 percent below); Dallas (73 percent below); Houston (52 percent below); Miami (44 percent below); and Atlanta (67 percent below).
Other major markets with first quarter foreclosure activity below pre-recession averages were San Francisco, Riverside-San Bernardino in Southern California, Phoenix, Detroit and Seattle.
“The markets HER Realtors serves are 28 to 45 percent below pre-recession levels,” said Matthew Watercutter, senior regional vice president and broker of record for HER Realtors, covering the Dayton, Columbus and Cincinnati markets in Ohio. “The reduced number of foreclosure properties is consistent with lower unemployment rates, and is contributing to the lack of inventory available to consumers. That low inventory, coupled with increased demand, is causing an increase in housing costs, a reduction in days on market and causing frustration among homebuyers wanting to purchase.”
Markets still above pre-recession levels include New York, Chicago, Philadelphia
In 114 out of the 216 markets analyzed (53 percent), first quarter foreclosure activity levels were still above pre-recession averages, including New York (80 percent above); Chicago (9 percent above); Philadelphia (97 percent above); Washington, D.C. (64 percent above); and Boston (26 percent above).
Other major markets with first quarter foreclosure activity above pre-recession averages included Baltimore, Virginia Beach, Providence, Rhode Island; Richmond, Virginia; and New Orleans.
March foreclosure starts up for second consecutive month, down from year ago
The report also shows a total of 83,145 U.S. properties with foreclosure filings in March 2017, up 1 percent from the previous month but down 24 percent from a year ago — the 18th consecutive month with a year-over-year decrease in overall U.S. foreclosure activity.
A total of 36,370 U.S. properties started the foreclosure process in March, up 6 percent from the previous month but still down 24 percent from a year ago. March marked the second consecutive month with a month-over-month increase in foreclosure starts, but foreclosure starts were down on a year-over-year basis for the 21st consecutive month in March.
Lenders completed the foreclosure process on 28,634 U.S. properties in March, down 4 percent from the previous month and down 15 percent from a year ago.

New Jersey, Maryland, Nevada post top state foreclosure rates in March
Nationwide in March one in every 1,604 properties had a foreclosure filing.
States with the highest foreclosure rates in March were New Jersey (one in every 497 housing units with a foreclosure filing); Maryland (one in every 820 housing units); Nevada (one in every 857 housing units); Delaware (one in every 858 housing units); and Illinois (one in every 863 housing units).
Trenton, Atlantic City, Philadelphia post top metro foreclosure rates in March
Among 216 metropolitan statistical areas with a population of at least 200,000, those with the highest foreclosure rates in March were Trenton, New Jersey (one in every 355 housing units with a foreclosure filing); Atlantic City, New Jersey (one in every 452 housing units); Philadelphia (one in every 577 housing units); Rockford, Illinois (one in every 631 housing units); and Peoria, Illinois (one in every 710 housing units).
Other metros posting top 10 foreclosure rates in March were Reading, Pennsylvania; Las Vegas; Chicago; Baltimore; and Ocala, Florida.
DC and 12 states post annual increase in foreclosure activity in March
Counter to the national trend, the District of Columbia and 12 states posted year-over-year increases in foreclosure activity in March, including New Jersey (34 percent increase); Oklahoma (13 percent increase); Louisiana (7 percent increase); Connecticut (6 percent increase); and Arizona (6 percent increase).
Two of the nation’s 10 largest metro areas posted a year-over-year increase in foreclosure activity in March: Philadelphia (up 15 percent); and Phoenix (up 1 percent).
Report methodology
The ATTOM Data Solutions U.S. Foreclosure Market Report provides a count of the total number of properties with at least one foreclosure filing entered into the ATTOM Data Warehouse during the month and quarter. Some foreclosure filings entered into the database during the year may have been recorded in the previous year. Data is collected from more than 2,200 counties nationwide, and those counties account for more than 90 percent of the U.S. population. ATTOM’s report incorporates documents filed in all three phases of foreclosure: Default — Notice of Default (NOD) and Lis Pendens (LIS); Auction — Notice of Trustee Sale and Notice of Foreclosure Sale (NTS and NFS); and Real Estate Owned, or REO properties (that have been foreclosed on and repurchased by a bank). For the annual and quarterly reports, if more than one type of foreclosure document is received for a property during the year or quarter, only the most recent filing is counted in the report. The annual, quarterly and monthly reports all check if the same type of document was filed against a property previously. If so, and if that previous filing occurred within the estimated foreclosure timeframe for the state where the property is located, the report does not count the property in the current year, quarter or month.
About ATTOM Data Solutions
ATTOM Data Solutions is the curator of the ATTOM Data Warehouse, a multi-sourced national property database that blends property tax, deed, mortgage, foreclosure, environmental risk, natural hazard, health hazards, neighborhood characteristics and other property characteristic data for more than 150 million U.S. residential and commercial properties. The ATTOM Data Warehouse delivers actionable data to businesses, consumers, government agencies, universities, policymakers and the media in multiple ways, including bulk file licenses, APIs and customized reports.
ATTOM Data Solutions also powers consumer websites designed to promote real estate transparency: RealtyTrac.com is a property search and research portal for foreclosures and other off-market properties; Homefacts.com is a neighborhood research portal providing hyperlocal risks and amenities information; HomeDisclosure.com produces detailed property pre-diligence reports.
ATTOM Data and its associated brands are cited by thousands of media outlets each month, including frequent mentions on CBS Evening News, The Today Show, CNBC, CNN, FOX News, PBS NewsHour and in The New York Times, Wall Street Journal, Washington Post, and USA TODAY.
Media Contact:
Jennifer von Pohlmann
949.502.8300, ext. 139
jennifer.vonpohlmann@attomdata.com
Data Licensing and Custom Report Orders
Investors, businesses and government institutions can contact ATTOM Data Solutions to purchase the full dataset behind the Environmental Hazards Housing Risk Index, including data at the state, metro, county and zip code level. The data is also available via bulk license or in customized reports. For more information contact our Data Solutions Department at 800.462.5125 or datasales@attomdata.com