
Nationwide Building Footprint Data
Enhance the Accuracy and Utility of Geospatial AnalysesExplore Comprehensive Building Footprints for Strategic Insight
ATTOM’s Building Footprint data provides a national map with over 187 million building outlines, detailing the outer edges of each structure at ground level. These polygons help with various planning and analysis tasks by showing where buildings are located, their shapes, and how they sit in relation to other buildings or places.
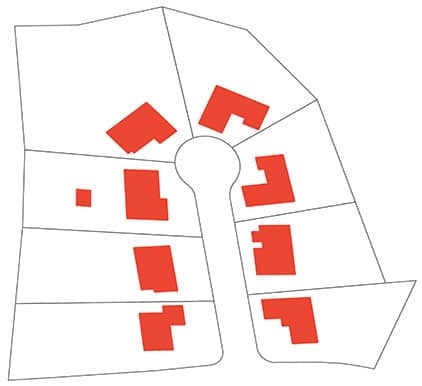
To create these polygons, advanced proprietary AI algorithms are deployed to detect buildings from aerial imagery and LiDAR (Light Detection and Ranging) data. These models have been trained over large training data sets to create robust AI models. In cities where buildings are very close together, special techniques are used to split the footprints into individual buildings using our parcel boundaries.
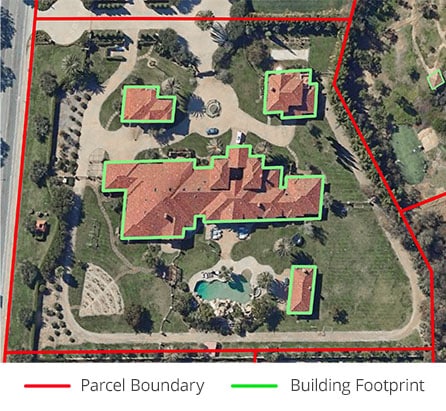
Building Footprints are Geospatially Matched to a Single Parcel Boundary
ATTOM’s Building Footprint data captures the exact shape and perimeter of a building using advanced proprietary AI algorithms to detect buildings. It delineates the physical outline of structures on the ground. A parcel boundary, on the other hand, defines a specific plot of land with established legal borders, commonly used in the real estate industry to outline property lines and ownership information. By geospatially matching ATTOM’s Building Footprint data with respective parcel boundaries, we ensure a detailed and precise mapping that harmonizes the actual dimensions of buildings with their legal land divisions. This precise coordination is essential for various industries who depend on accurate and holistic geographic data for making informed decisions, assessing risk, effective property management, and more.
Key Features Include:
- Nationwide coverage of over 187 million Building Footprints for all property types.
- Building accuracy has been validated across urban areas nationwide, ensuring high precision on a pixel-by-pixel basis.
- Existing buildings are realigned with updated parcel data every quarter, and new buildings are incorporated into the system twice a year.
- Linked to our assessor and parcel boundary products.
- Building footprint data covers both main structures and smaller buildings like pool houses, improving accuracy for property evaluations.

What is Building Footprint Data?
Building Footprint data consists of polygons outlining a building’s ground-level perimeter, and they support a variety of mapping and analytic use cases for various industries.
How Can You Use ATTOM’s Building Footprint Data?
Insurance
Understand building quantity and location on insured properties to accurately assess risk and estimate costs.
Show building footprint boundaries and property details by linking to Parcel Boundary and Assessor products, or add your own data using address, APN, or location.
Enhance underwriting accuracy and avoid mispricing policies by utilizing high-precision building footprints to assess risks from natural hazards.
Help solar energy providers optimize rooftop panel installations and enable telecommunications companies to estimate deployment costs, enhance service coverage, and strategically expand into new areas.
Determine development limitations, evaluate property sale values, map urban heat islands, analyze urban growth, and strategize for electric vehicle charging stations or street lighting installations.
Build more accurate location-aware user experiences and notification systems based on the actual building footprint rather than a less accurate radius search.
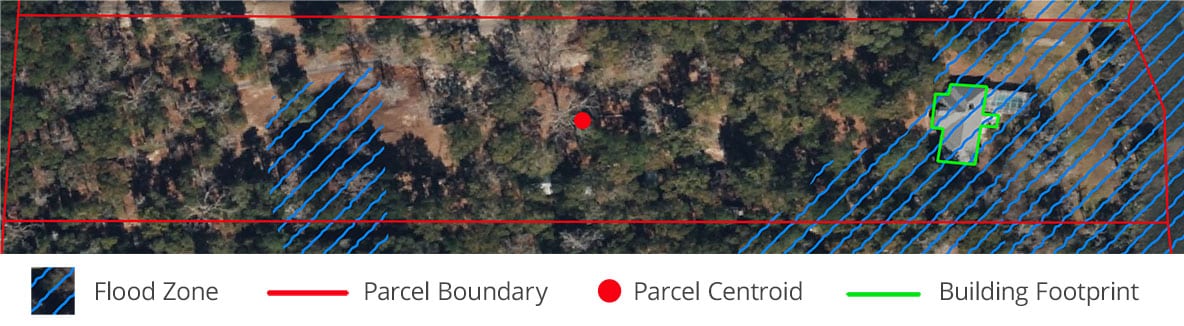
Precise Building Locations Key to Identifying Hazard Risks
Unlocking the Power of Building Footprints and Other Geo-Spatial Data Products for Your Business
Join us for an engaging webinar featuring Sean Mooney, VP of Product Management, and Peter Yunker, SVP Geospatial Solutions. Dive into the diverse applications of ATTOM’s geospatial boundary products, now enriched with our latest addition – Building Footprints. These footprints consist of polygons outlining a building’s ground-level perimeter, and they support a variety of mapping and analytic use cases for insurance and real estate markets. Learn how these resources empower enhanced hyperlocal search, comprehensive map visualizations, precise data enrichment, and robust geospatial analysis across various industries.

Key Features Covered
- Building Footprints – NEW data product from ATTOM!
- Parcel Boundaries
- Neighborhood Boundaries
- School Attendance Area
Don’t miss out on this opportunity to expand your understanding and utilization of critical geospatial data to unlock new potential for your business.
A Variety of Solutions for Your Data Needs
Click here to get in touch with a data expert today and find out how your business can access ATTOM’s comprehensive property data via a variety of flexible formats, such as:
- Cloud Delivery
- ATTOM Nexus
- AI-Ready Solutions
- Property Data APIs
- Bulk Data Licensing
- Property Navigator
- Neighborhood Navigator
- Real Estate Market Reports
- Match & Append
Discover ATTOM and view our Table of Data Elements.


