
This week ATTOM Data Solutions released its Q1 2019 U.S. Home Affordability Index, which shows that median-priced homes were not affordable for average wage earners in the first quarter of 2019 in 71 percent of the U.S. housing markets.
Affordability for average wage earners was determined by calculating the amount of income needed to make monthly house payments on a median-priced home, assuming a 3 percent down payment and a 28 percent maximum “front-end” debt-to-income ratio. That required income was then compared to annualized average weekly wage data from the Bureau of Labor Statistics.
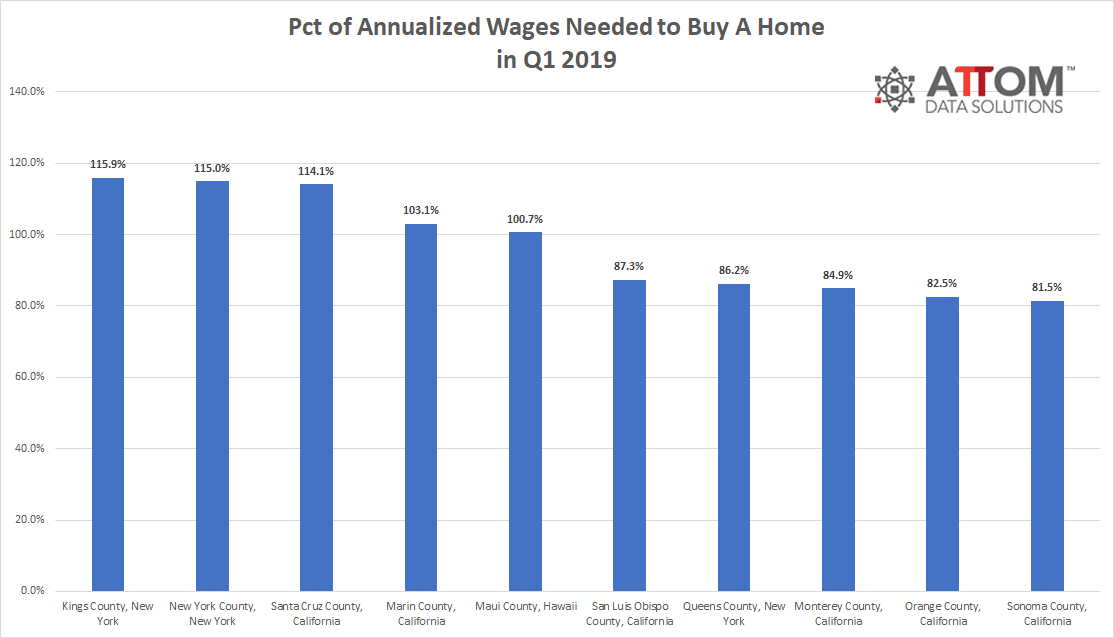
Of the 473 U.S. counties included in the analysis, 335 (71 percent) were not affordable for average wage earners. Among those, was Orange County, California, where the annual income needed to buy was $184,022 which was well above the $62,478 average annual wage there. In Orange County, an average wage earner would need to spend 82.5 percent of his or her income to buy a median-priced home in the first quarter of 2019.
Here are the top 10 counties where the greatest percent of annualized wages was needed to buy a home in Q1 2019:

Contact us to learn which counties in Q1 were still affordable for the average wage earner and which counties required the lowest share of income needed to buy.
Historic Averages & Worsening Affordability
Among the 473 counties analyzed in the report, 232 (49 percent) were less affordable than their historic affordability averages in the first quarter of 2019, down from 76 percent of counties in the previous quarter but up from 42 percent of counties in the first quarter of 2018.
A total of 308 of the 473 counties analyzed in the report (65 percent) posted a year-over-year decrease in their affordability index, meaning that home prices were less affordable than a year ago.
Contact us to learn if your county was less or more affordable in Q1 than its historic affordability average and whether your county posted a decrease or increase in affordability.
Finally, in Q1 2019 home price appreciation outpaced average weekly wage growth in 232 of the 473 counties analyzed in the report (49 percent). Contact us to find out where the average weekly wage growth outpaced home price appreciation.