Median Home Sale Prices Hit an All-Time High at $248,000 in 2018; Homeowners Staying Put Longer as Average Homeownership Tenure Rises to New High
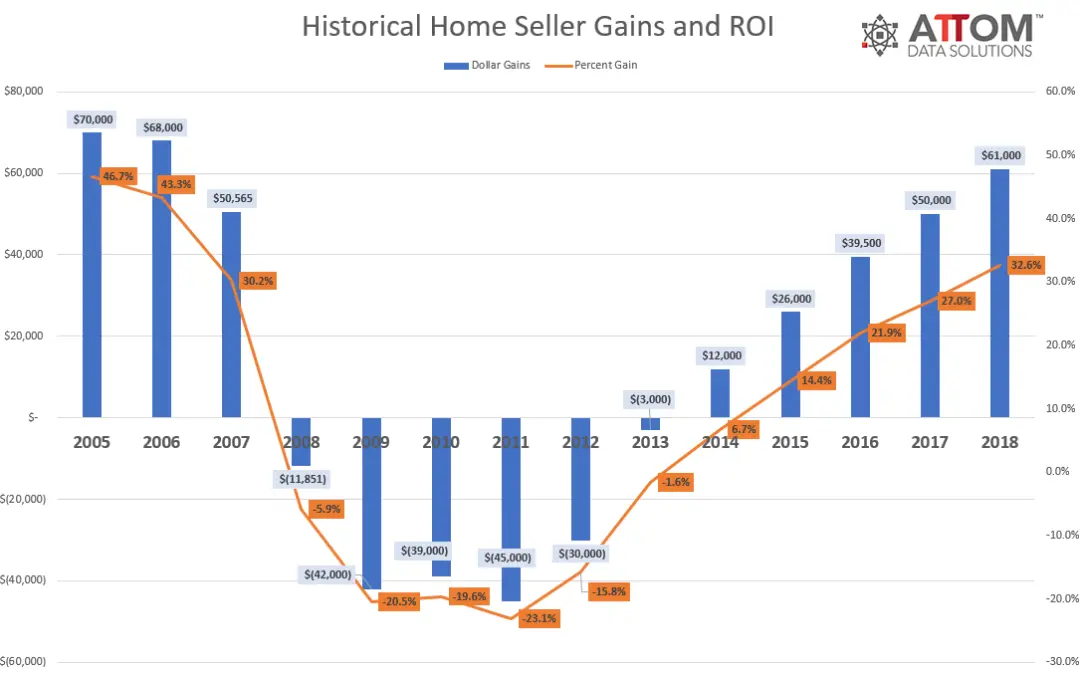
IRVINE, Calif. – Jan. 31, 2019 — ATTOM Data Solutions, curator of the nation’s premier property database, today released its Year-End 2018 U.S. Home Sales Report, which shows that home sellers in 2018 realized an average home price gain since purchase of $61,000, up from $50,000 last year and up from $39,500 two years ago in 2016 to the highest level since 2006 — a 12-year high.
That $61,000 average home seller profit represented an average 32.6 percent return on investment compared to the original purchase price, up from 27.0 percent last year and up from 21.9 percent in 2016 to the highest average home seller ROI since 2006. For a detailed home sales data analysis, click here.
“While 2018 was the most profitable time to sell a home in more than 12 years, those along the coasts, reaped the most gains. However, those are the same areas where homeowners are staying put longer,” said Todd Teta, chief product officer at ATTOM Data Solutions. “The economy is still going strong and home loan rates remain historically low. But there are potential clouds on the horizon. The effects of last year’s tax cuts are wearing off as limits on homeowner tax deductions are in place and mortgage rates are ticking up ever so slowly, so this could dampen the potential for home price gains in 2019.”
Among 217 metropolitan statistical areas with a population greater than 200,000 and sufficient historical data, the highest returns on investment were almost exclusively in western states, with concentrations along areas of the west coast. Those with the highest average home seller ROI were San Jose, California (108.8 percent); San Francisco, California (78.6 percent); Seattle, Washington (70.7 percent); Merced, California (66.4 percent); and Santa Rosa, California (66.1 percent).
“Home price growth in the Seattle area has started to soften, something that home buyers have been waiting for, and a trend that we can expect to continue in the coming year,” said Matthew Gardner, chief economist at Windermere Real Estate, covering the Seattle market. “Seattle is still benefitting from buyers moving here from more expensive markets, such as California, but the market cannot solely depend on this demographic. My forecast for 2019 is that it will be a year of movement back to balance, which is a very positive thing.”
Historical U.S. Home Seller Gains
San Jose and Las Vegas lead major metros in home price appreciation
The U.S. median home price in 2018 was $248,000, up 5.5 percent from 2017 to a new all-time high. Annual home price appreciation in 2018 slowed slightly compared to the 7.1 percent in 2017.
Among 127 metropolitan statistical areas with a population of 200,000 or more and sufficient home price data, those with the biggest year-over-year increase in home prices were Mobile, Alabama (up 21 percent); Flint, Michigan (up 19 percent); San Jose, California (up 18.9 percent); Atlantic City, New Jersey (up 16.4 percent) and Las Vegas, Nevada (up 13.5 percent).
Along with San Jose and Las Vegas, other major metro areas with a population of at least 1 million with a double-digit percentage increase in home prices in 2018 were Grand Rapids, Michigan (up 10.6 percent); San Francisco, California (up 10.3 percent); Columbus, Ohio (up 10.1 percent); and Atlanta, Georgia (up 10.1 percent).
88 of the 127 metros (69 percent) reached new record home price peaks in 2018, including Los Angeles, Dallas-Fort Worth, Houston, Atlanta, and Boston.
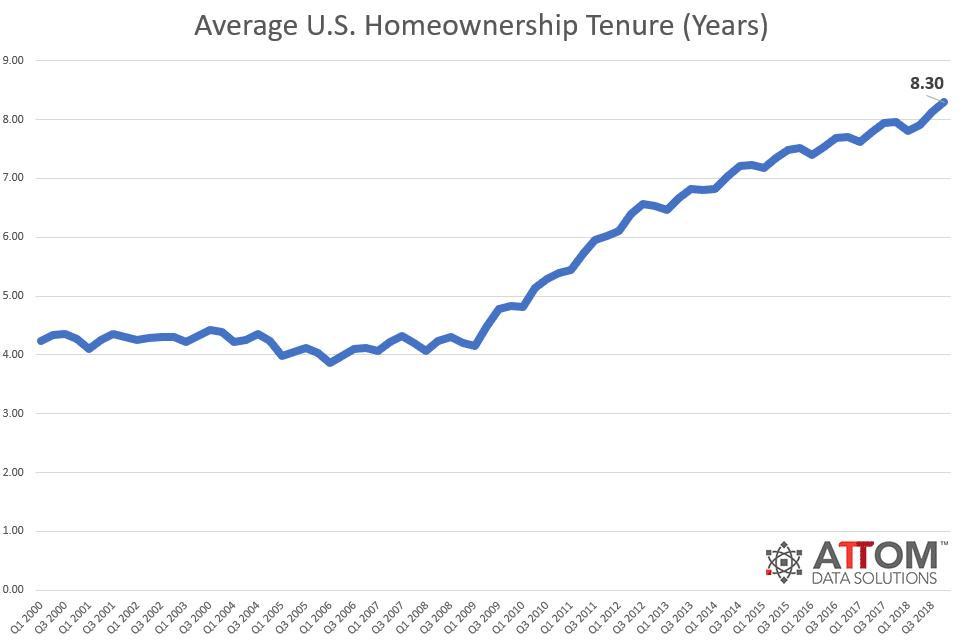
Homeownership tenure at new record high nationwide, down in Vallejo, Reno, Tucson
Homeowners who sold in the fourth quarter of 2018 had owned their homes an average of 8.30 years, up from 8.13 years in the previous quarter and up from 7.95 years in Q4 2017 to the longest average home seller tenure as far back as data is available, Q1 2000.
Average U.S. Homeownership Tenure
Counter to the national trend, 16 of the 108 metro areas analyzed in the report posted a year-over-year decrease in average home seller tenure including: Vallejo-Fairfield, California (down 5 percent); Reno, Nevada (down 3 percent); Redding, California (down 2 percent); Panama City, Florida (down 2 percent); Chattanooga, Tennessee (down 2 percent); Eugene, Oregon (down 2 percent); Crestview-Fort Walton Beach, Florida (down 1 percent); Tucson, Arizona (down 1 percent), Punta Gorda, Florida (down less than 1 percent); Manchester-Nashua, New Hampshire (down less than 1 percent); and Truckee, California (down less than 1 percent).
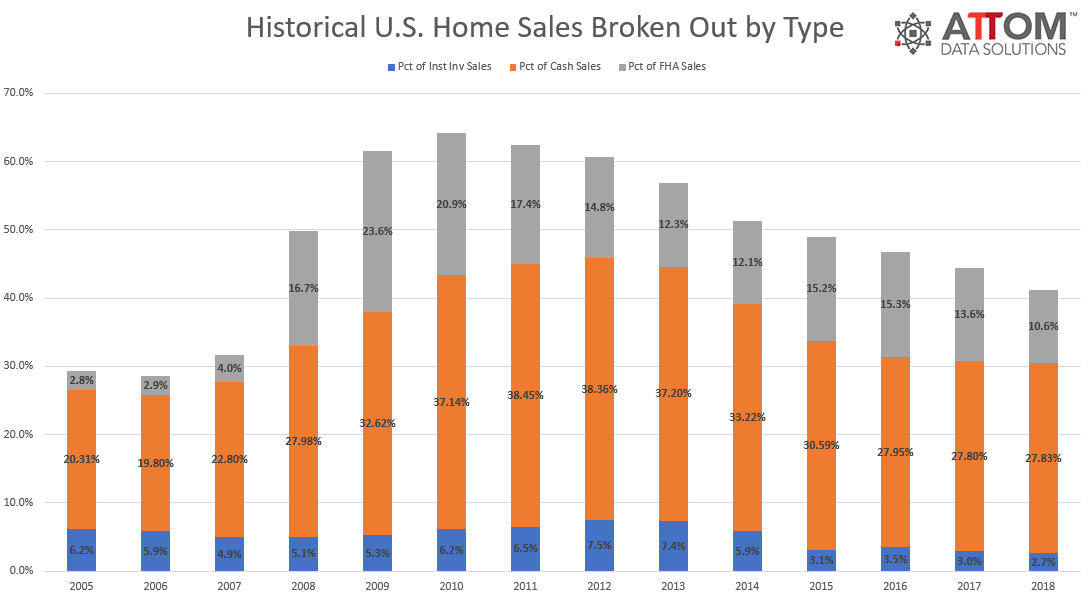
Nearly three in 10 home buyers made all-cash purchases in 2018
Nationwide all-cash purchases accounted for 27.8 percent of single-family home and condo sales in 2018, unchanged from 2017 but down from its peak in 2011 at 38.4 percent. However, this is still well above the pre-recession average of 18.7 percent between 2000 and 2007.
Among 200 metropolitan statistical areas with a population of at least 200,000 and sufficient cash sales data, those with the highest share of all-cash purchases in 2018 were Montgomery, Alabama (53.6 percent); Naples, Florida (52.5 percent); Macon, Georgia (50.8 percent); Cape Coral-Fort Myers, Florida (45.4 percent); and North Port-Sarasota, Florida (45.4 percent).
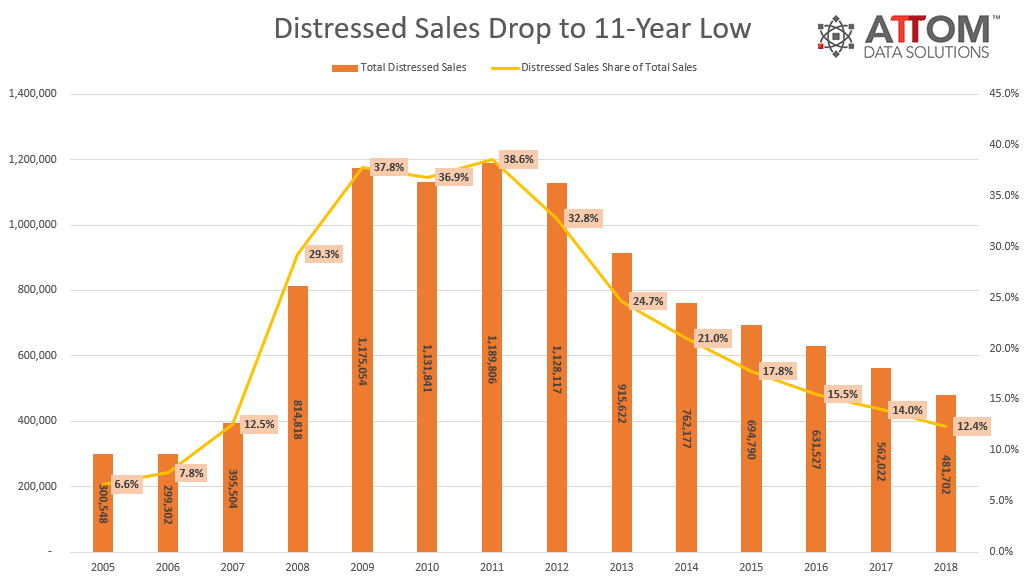
U.S. distressed sales share drops to 11-year low, up in 8 states
Distressed home sales — including bank-owned (REO) sales, third-party foreclosure auction sales, and short sales — accounted for 12.4 percent of all U.S. single family home and condo sales in 2018, down from 14.0 percent in 2017 and down from a peak of 38.6 percent in 2011.
Counter to the national trend, the share of distressed sales increased in 2018 in Kansas (up 13 percent); Louisiana (up 13 percent); Wisconsin (up 2 percent); Kentucky (up 2 percent); Maine (up 1 percent); Colorado (up 1 percent); Indiana (up 1 percent); and West Virginia (up 1 percent).
Among 209 metropolitan statistical areas with a population of at least 200,000 those with the highest share of distressed sales in 2018 were Atlantic City, New Jersey (37.2 percent); Montgomery, Alabama (25.2 percent); Trenton, New Jersey (23.8 percent); Youngstown, Ohio (23.6 percent); and Rockford, Illinois (22.1 percent).
Among 53 metropolitan statistical areas with a population of at least 1 million, those with the highest share of distressed sales in 2018 were Philadelphia, Pennsylvania (20.7 percent); Baltimore, Maryland (19.9 percent); Cleveland, Ohio (19.4 percent); Memphis, Tennessee (19.1 percent); and Providence, Rhode Island (18.3 percent).
Institutional investors dropped for the fifth straight year
Institutional investors nationwide accounted for 2.7 percent of all single-family home and condo sales in 2018, down from 3.0 percent in 2017.
Among 200 metropolitan statistical areas with a population of at least 200,000 and sufficient institutional investor sales data, those with the highest share of institutional investor sales in 2018 were Montgomery, Alabama (9.6 percent); Memphis, Tennessee (8.1 percent); Columbia, South Carolina (7.6 percent); Birmingham, Alabama (7.1 percent); Atlanta, Georgia (7.0 percent); and Charlotte, North Carolina (6.5 percent).
Historical U.S. Home Sales By Type
Texas metro areas dominated list with the most FHA sales in 2018
Nationwide buyers using Federal Housing Administration (FHA) loans accounted for 10.6 percent of all single-family home and condo purchases in 2018, down from 13.6 percent in 2017 to the lowest level since 2007.
Among 200 metropolitan statistical areas with a population of at least 200,000 and sufficient FHA buyer data, 6 out of the top 10 metro areas with the highest share of FHA sales were in Texas. Those with the highest share of FHA buyers in 2018 were McAllen, Texas (26.3 percent); El Paso, Texas (25.3 percent); Amarillo, Texas (23.0 percent); Beaumont-Port Arthur, Texas (22.7 percent); and Elkhart, Indiana (21.5 percent).
###
Report methodology
Data for the ATTOM Data Solutions U.S. Home Sales Report is derived from recorded sales deeds, foreclosure filings and loan data. Statistics for previous quarters are revised when each new report is issued as more deed data becomes available for those previous months. Median sales prices are calculated based on the sales price on the publicly recorded sales deed when available. If no sales price is recorded then the purchase loan amount is used to calculate median price, and if no purchase loan amount is available, the property’s Automated Valuation Model (AVM) at time of sale is used to calculate the median price.
Definitions
All-cash purchases: sales where no loan is recorded at the time of sale and where ATTOM has coverage of loan data.
Institutional investor purchases: residential property sales to non-lending entities that purchased at least 10 properties in a calendar year.
REO sale: a sale of a property that occurs while the property is actively bank owned (REO).
Third-party foreclosure auction sale: a sale of a property that occurs at the public foreclosure auction (trustee’s sale or sheriff’s sale) in which the property is sold to a third-party buyer and does not transfer back to the foreclosing bank.
Short sale: a sale of a property where the sale price is less than (short) the combined amount of loans secured by the property.
About ATTOM Data Solutions
ATTOM Data Solutions provides premium property data to power products that improve transparency, innovation, efficiency and disruption in a data-driven economy. ATTOM multi-sources property tax, deed, mortgage, foreclosure, environmental risk, natural hazard, and neighborhood data for more than 155 million U.S. residential and commercial properties covering 99 percent of the nation’s population. A rigorous data management process involving more than 20 steps validates, standardizes and enhances the data collected by ATTOM, assigning each property record with a persistent, unique ID — the ATTOM ID. The 9TB ATTOM Data Warehouse fuels innovation in many industries including mortgage, real estate, insurance, marketing, government and more through flexible data delivery solutions that include bulk file licenses, APIs, market trends, marketing lists, match & append and more.
Media Contact:
Christine Stricker
949.748.8428
christine.stricker@attomdata.com
Data and Report Licensing:
949.502.8313
