ATTOM Data Solutions’ recently released Q4 2020 Opportunity Zones Report found that among the qualified Opportunity Zones designated by the Tax Cuts and Jobs Acts of 2017, median home prices increased from Q4 2019 to Q4 2020 in 77 percent of those designated zones with sufficient data. The report also found that median prices rose by more than 10 percent in nearly two-thirds of the zones analyzed. Those percentages were roughly the same as in areas of the U.S. outside of the designed zones.
According to ATTOM’s latest opportunity zones analysis, while prices remain well below average in most Opportunity Zones, about 38 percent of the zones with enough data to analyze still had median prices of less than $150,000 in Q4 2020. The analysis noted that figure was down from 46 percent a year earlier as prices inside some of the nation’s poorest communities rolled ahead with the broader market.
The Q4 Opportunity Zones report also noted that of all 3,588 zones included in the report, 1,356 or 38 percent had a median price in Q4 2020 that was less than $150,000, and 598 or 17 percent had medians ranging from $150,000 to $199,999. The report stated the total percentage of zones with typical values below $200,000 was down from 64 percent in Q4 2019. The analysis also stated that median values in Q4 2020 ranged from $200,000 to $299,999 in 837 or 23 percent of the Opportunity Zones, while they were at least $300,000 in 797 or 22 percent.
In this post, we take a deep dive into the data behind our Q4 2020 Opportunity Zones report to uncover the top 10 zones with the greatest annual gains among those zones with median prices between $100,00 and $149,000 and located in the more populated counties with 1-5 million people. Among those zones, those that saw the greatest annual gains in median home sales were: 39049008821 in Franklin County, OH; 26163538500 in Wayne County, MI; 9035154501 in Cuyahoga County, OH; 13121007807 in Fulton County, GA; 39049007710 in Franklin County, OH; 13121008102 in Fulton County, GA; 37119004500 in Mecklenburg County, NC; 39035117700 in Cuyahoga County, OH; 42101008400 in Philadelphia County, PA; and 42101014900 in Philadelphia County, PA.

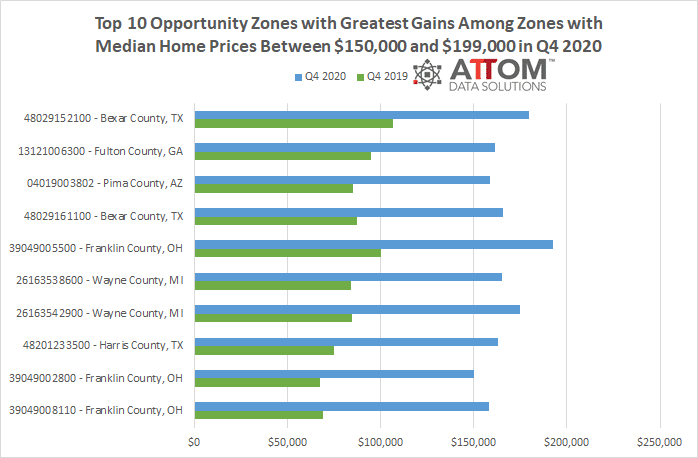
Also, in this post, we take a deep dive into the data behind our Q4 2020 Opportunity Zones report to uncover the top 10 zones with the greatest annual gains among those zones with median prices between $150,00 and $199,000 and located in the more populated counties with 1-5 million people. Among those zones, those that saw the greatest annual gains in median home sales were: 39049008110 in Franklin County, OH; 39049002800 in Franklin County, OH; 48201233500 in Harris County, TX; 26163542900 in Wayne County, MI; 26163538600 in Wayne County, MI; 39049005500 in Franklin County, OH; 48029161100 in Bexar County, TX; 04019003802 in Pima County, AZ; 13121006300 in Fulton County, GA; and 48029152100 in Bexar County, TX.
ATTOM’s Q4 2020 Opportunity Zones report also noted that the pandemic’s impact generally has hit hardest in lower-income communities that comprise most of the zones targeted for tax breaks designed to spur economic redevelopment. While housing markets inside Opportunity Zones continued to benefit from the nation’s nine-year price boom.
Opportunity Zones are defined in the Tax Act legislation as census tracts in or alongside low-income neighborhoods that met various criteria for redevelopment in all 50 states, the District of Columbia and U.S. territories. Census tracts, as defined by the U.S. Census Bureau, cover areas with 1,200 to 8,000 residents, with an average of about 4,000 people.
Want to learn more about Opportunity Zones in your area? Contact us to find out how!