According to ATTOM’s just released Q3 2021 U.S. Foreclosure Market Report, foreclosure filings in Q3 2021 were up 34 percent from Q2 2021 and 68 percent from Q3 2020, with 45,517 U.S. properties receiving a foreclosure filing. The report also revealed that foreclosure filings in September 2021 were up 24 percent from August 2021 and 102 percent from September 2020, with 19,609 U.S. properties receiving a foreclosure filing.
ATTOM’s latest foreclosure activity analysis found that lenders started the foreclosure process on 25,209 U.S. properties in Q3 2021 – up 32 percent from Q2 2021 and 67 percent from Q3 2020, marking the first double digit quarterly percent increase since 2014. The Q3 2021 report noted that lenders repossessed 7,574 U.S. properties through foreclosure (REO) in Q3 2021 – up 22 percent from Q2 2021 and 46 percent from Q3 2020, marking the first quarterly increase since Q1 2016.
The Q3 2021 foreclosure report also states that nationwide, one in every 3,019 properties had a foreclosure filing in Q3 2021. Also according to the report, states with the highest foreclosure rates in Q3 2021 were Nevada (one in every 1,463 housing units with a foreclosure filing); Illinois (one in every 1,465); Delaware (one in every 1,515); New Jersey (one in every 1,667); and Florida (one in every 1,743).
ATTOM’s Q3 2021 foreclosure report notes that among 220 metro areas analyzed, those with the highest foreclosure rates in Q3 2021 were Atlantic City, New Jersey (one in every 709 housing units with a foreclosure filing); Peoria, Illinois (one in every 754); Bakersfield, CA (one in every 923); Cleveland, Ohio (one in every 936); and Las Vegas, Nevada (one in every 1,167).
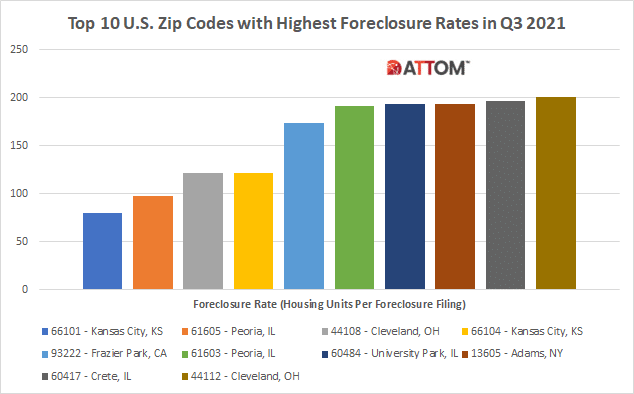
In this post, we take a deep dive into the data behind ATTOM’s Q3 2021 foreclosure market report to uncover the top 10 U.S. zip codes with the highest foreclosure rates among those with at least 1,000 housing units. Those top zips seeing the highest foreclosure rates in Q3 2021 include: 66101 in Kansas City, KS (one in every 80); 61605 in Peoria, IL (one in every 98); 44108 in Cleveland, OH (one in every 122); 66104 – Kansas City, KS (one in every 122); 93222 in Frazier Park, CA (one in every 174); 61603 in Peoria, IL (one in every 191); 60484 in University Park, IL (one in every 193); 13605 in Adams, NY (one in every 194); 60417 in Crete, IL (one in every 197); and 44112 in Cleveland, OH (one in every 201).
ATTOM’s Q3 2021 foreclosure market analysis also reported that properties foreclosed in Q3 2021 had been in the foreclosure process an average of 924 days. That number was up slightly from 922 days in the Q2 2021, but up 11 percent from 830 days in Q3 2020. The report mentioned that states with the longest average foreclosure timelines for homes foreclosed in Q3 2021 were Hawaii (2,070 days); Nevada (1,989 days); Kansas (1,901 days); New York (1,659 days); and Washington (1,611 days).
The latest foreclosure report from ATTOM also featured the high-level findings from the September 2021 analysis, including: Nationwide, in September 2021 one in every 7,008 properties had a foreclosure filing, while states with the highest foreclosure rates in September 2021 were Florida (one in every 3,276 housing units with a foreclosure filing); Illinois (one in every 3,508 housing units); Delaware (one in every 3,834 housing units); Nevada (one in every 4,009 housing units); and New Jersey (one in every 4,487 housing units).
Want to learn more about how foreclosures are faring in your market? Contact us to find out how!
