
U.S. Foreclosure Starts Increase 167 Percent From a Year Ago; Average Time to Foreclose Nationwide Decreases 4 Percent From a Year Ago
IRVINE, Calif. – Oct. 13, 2022 — ATTOM, a leading curator of real estate data nationwide for land and property data, released its Q3 2022 U.S. Foreclosure Market Report, which shows there were a total of 92,634 U.S. properties with foreclosure activity — default notices, scheduled auctions or bank repossessions — up 3 percent from the previous quarter and 104 percent from a year ago.
The report also shows there were a total of 31,836 U.S. properties with foreclosure filings in September 2022, down 8 percent from the previous month but up 62 percent from September 2021.
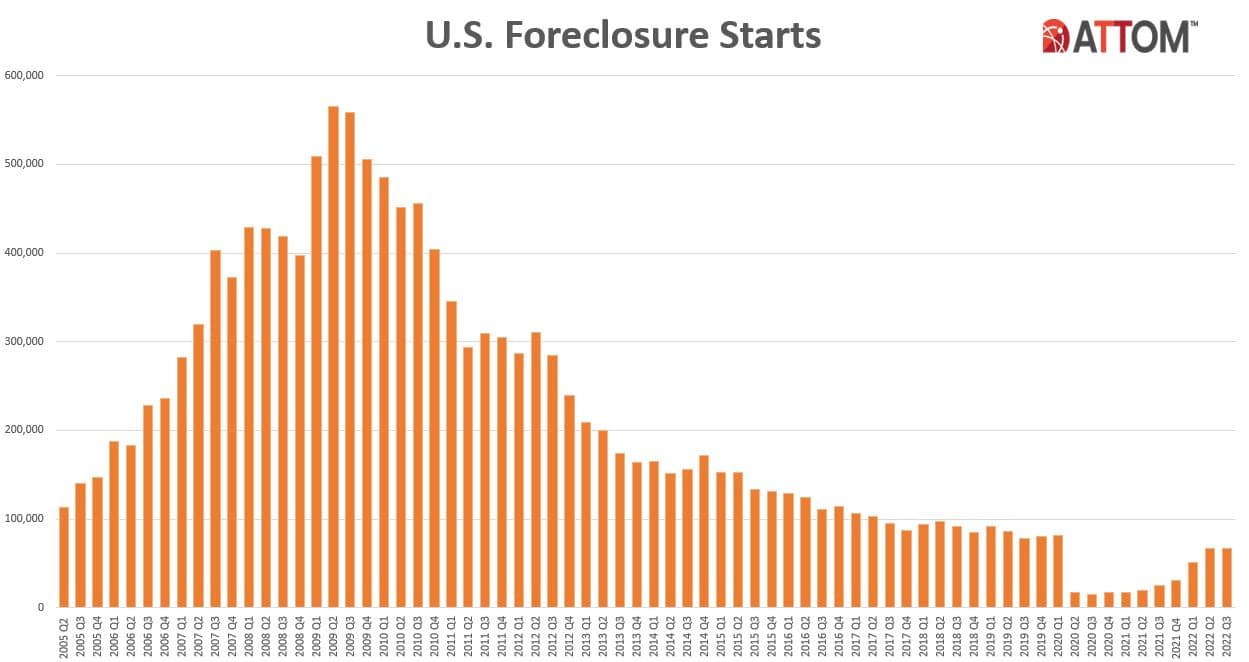
Foreclosure starts close to pre-pandemic levels nationwide
Lenders started the foreclosure process on 67,249 U.S. properties in Q3 2022, up 1 percent from the previous quarter and up 167 percent from a year ago — nearly reaching pre-pandemic levels.
“Foreclosure starts, while rising since the end of the government’s foreclosure moratorium, still lag behind pre-pandemic levels,” said Rick Sharga, executive vice president of market intelligence for ATTOM. “Foreclosure activity is reflecting other aspects of the economy, as unemployment rates continue to be historically low, and mortgage delinquency rates are lower than they were before the COVID-19 outbreak.”
States that posted the greatest number of foreclosure starts in Q3 2022, included California (7,368 foreclosure starts); Florida (6,671 foreclosure starts); Texas (6,217 foreclosure starts); Illinois (4,702 foreclosure starts); and New York (3,997 foreclosure starts).
Among the 223 metropolitan statistical areas analyzed in the report those that posted the greatest number of foreclosure starts in Q3 2022, included New York, New York (4,621 foreclosure starts); Chicago, Illinois (3,950 foreclosure starts); Los Angeles, California (2,275 foreclosure starts); Philadelphia, Pennsylvania (1,991 foreclosure starts); and Miami, Florida (1,990 foreclosure starts);
Counter to the national trend of quarterly increases, among those metropolitan areas with a population greater than one million that saw a decline in foreclosure starts in Q3 2022 were Tulsa, Oklahoma (down 60 percent); Kansas City, Missouri (down 26 percent); Birmingham, Alabama (down 25 percent); Minneapolis, Minnesota (down 23 percent); and Cincinnati, Ohio (down 22 percent).
Highest foreclosure rates in Illinois, Delaware, and New Jersey
Nationwide one in every 1,517 properties had a foreclosure filing in Q3 2022. States with the highest foreclosure rates in Q3 2022 were Illinois (one in every 694 housing units with a foreclosure filing); Delaware (one in every 825); New Jersey (one in every 855); South Carolina (one in every 971); and Ohio (one in every 1,027).
Among 223 metropolitan statistical areas analyzed in the report, those with the highest foreclosure rates in Q3 2022 were Peoria, Illinois (one in every 472 housing units with a foreclosure filing); Cleveland, Ohio (one in every 589); Jacksonville, North Carolina (one in every 593); Columbia, South Carolina (one in every 599); and Rockford, Illinois (one in every 602).
Bank repossessions increase nationwide
Lenders repossessed 10,515 U.S. properties through foreclosure (REO) in Q3 2022, up 18 percent from the previous quarter and up 39 percent from a year ago.
“Very few of the properties entering the foreclosure process have reverted to the lender at the end of the foreclosure,” Sharga noted. “In fact, nearly three times more homes were repossessed by lenders in the second quarter of 2019 than in the second quarter of 2022. We believe that this may be an indication that borrowers are leveraging their equity and selling their homes rather than risking the loss of their equity in a foreclosure auction.”

States that posted the largest number of completed foreclosures in Q3 2022, included Illinois (1,331 REOs); Michigan (729 REOs); New York (695 REOs); Pennsylvania (643 REOs); and Ohio (557 REOs).
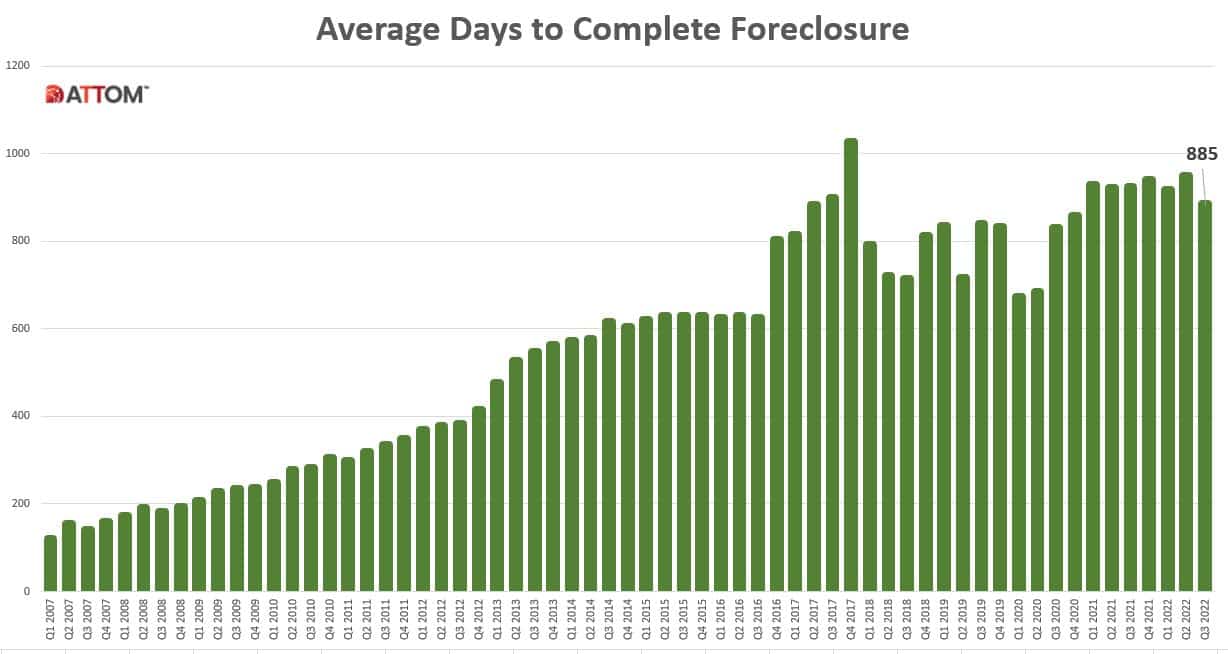
Average time to foreclose decreases 4 percent from last year
Properties foreclosed in Q3 2022 had been in the foreclosure process an average of 885 days, down from 948 days in the previous quarter and down 4 percent from 924 days in Q3 2021.
States with the longest average foreclosure timelines for homes foreclosed in Q3 2022 were Hawaii (2,121 days); New Jersey (2,002 days); Louisiana (1,963 days); Kansas (1,848 days); and New York (1,808 days).
States with the shortest average foreclosure timelines for homes foreclosed in Q3 2022 were Minnesota (113 days); Mississippi (167 days); Texas (168 days); Nebraska (168 days); and Missouri (172 days).
September 2022 Foreclosure Activity High-Level Takeaways
- Nationwide in September 2022 one in every 4,413 properties had a foreclosure filing.
- States with the highest foreclosure rates in September 2022 were Illinois (one in every 1,959 housing units with a foreclosure filing); Nevada (one in every 2,473 housing units); New Jersey (one in every 2,649 housing units); Maryland (one in every 2,825 housing units); and Ohio (one in every 2,885 housing units).
- 21,869 U.S. properties started the foreclosure process in September 2022, down 9 percent from the previous month but up 113 percent from a year ago.
- Lenders completed the foreclosure process on 3,509 U.S. properties in September 2022, down 11 percent from the previous month but up 31 percent from a year ago.
U.S. Foreclosure Market Data by State – Q3 2022
| Rate Rank | State Name | Total Properties with Filings | 1/every X HU (Foreclosure Rate) | %∆ Q2 2022 | %∆ Q3 2021 |
| U.S. | 92,634 | 1,517 | 2.77 | 103.52 | |
| 18 | Alabama | 1,271 | 1,800 | -7.43 | 74.83 |
| 21 | Alaska | 165 | 1,924 | 51.38 | 101.22 |
| 32 | Arizona | 1,281 | 2,406 | -12.62 | 130.40 |
| 38 | Arkansas | 461 | 2,962 | 24.26 | 94.51 |
| 12 | California | 10,850 | 1,326 | 11.04 | 77.55 |
| 26 | Colorado | 1,172 | 2,126 | -22.84 | 224.65 |
| 10 | Connecticut | 1,205 | 1,270 | 3.34 | 100.50 |
| 2 | Delaware | 544 | 825 | 2.45 | 90.21 |
| District of Columbia | 58 | 6,041 | 9.43 | 123.08 | |
| 7 | Florida | 9,284 | 1,063 | -3.93 | 71.26 |
| 14 | Georgia | 3,021 | 1,460 | -3.11 | 141.29 |
| 31 | Hawaii | 239 | 2,348 | 20.10 | 77.04 |
| 44 | Idaho | 180 | 4,177 | -9.09 | 83.67 |
| 1 | Illinois | 7,821 | 694 | 2.84 | 113.75 |
| 8 | Indiana | 2,533 | 1,154 | -1.40 | 76.52 |
| 15 | Iowa | 942 | 1,500 | -1.67 | 98.73 |
| 41 | Kansas | 405 | 3,150 | 114.29 | 20.18 |
| 45 | Kentucky | 447 | 4,462 | 8.50 | 35.45 |
| 20 | Louisiana | 1,085 | 1,911 | 6.90 | 89.69 |
| 19 | Maine | 388 | 1,905 | -1.02 | 83.89 |
| 9 | Maryland | 2,103 | 1,203 | 47.79 | 141.72 |
| 29 | Massachusetts | 1,337 | 2,243 | 26.61 | 101.36 |
| 11 | Michigan | 3,547 | 1,288 | 20.77 | 242.04 |
| 28 | Minnesota | 1,117 | 2,225 | -18.94 | 184.22 |
| 35 | Mississippi | 507 | 2,603 | -1.17 | 108.64 |
| 34 | Missouri | 1,132 | 2,462 | -19.77 | 63.82 |
| 46 | Montana | 103 | 4,998 | -8.85 | 202.94 |
| 39 | Nebraska | 285 | 2,962 | -14.93 | 176.70 |
| 6 | Nevada | 1,241 | 1,032 | 8.67 | 45.15 |
| 37 | New Hampshire | 226 | 2,827 | 6.10 | 98.25 |
| 3 | New Jersey | 4,401 | 855 | -3.10 | 102.90 |
| 30 | New Mexico | 404 | 2,329 | -5.16 | 31.60 |
| 13 | New York | 5,926 | 1,432 | 31.57 | 187.95 |
| 17 | North Carolina | 2,646 | 1,780 | -9.88 | 104.64 |
| 48 | North Dakota | 45 | 8,236 | 4.65 | 60.71 |
| 5 | Ohio | 5,106 | 1,027 | -12.63 | 96.54 |
| 23 | Oklahoma | 877 | 1,992 | -25.30 | 89.01 |
| 42 | Oregon | 573 | 3,165 | 35.78 | 402.63 |
| 22 | Pennsylvania | 2,911 | 1,973 | 1.36 | 129.39 |
| 36 | Rhode Island | 184 | 2,628 | 8.24 | 80.39 |
| 4 | South Carolina | 2,415 | 971 | 0.00 | 123.40 |
| 49 | South Dakota | 23 | 16,953 | 9.52 | 35.29 |
| 33 | Tennessee | 1,240 | 2,445 | 35.82 | 76.89 |
| 16 | Texas | 6,593 | 1,758 | -0.42 | 114.34 |
| 25 | Utah | 562 | 2,049 | 4.66 | 143.29 |
| 50 | Vermont | 15 | 22,288 | -25.00 | -51.61 |
| 27 | Virginia | 1,701 | 2,127 | 5.19 | 175.24 |
| 43 | Washington | 857 | 3,737 | 26.40 | 55.82 |
| 47 | West Virginia | 167 | 5,124 | 5.03 | 317.50 |
| 40 | Wisconsin | 905 | 3,014 | -1.63 | 14.27 |
| 24 | Wyoming | 133 | 2,044 | 25.47 | 111.11 |
Report methodology
The ATTOM U.S. Foreclosure Market Report provides a count of the total number of properties with at least one foreclosure filing entered into the ATTOM Data Warehouse during the month and quarter. Some foreclosure data entered into the database during the quarter may have been recorded in the previous quarter. Data is collected from more than 3,000 counties nationwide, and those counties account for more than 99 percent of the U.S. population. ATTOM’s report incorporates documents filed in all three phases of foreclosure: Default — Notice of Default (NOD) and Lis Pendens (LIS); Auction — Notice of Trustee Sale and Notice of Foreclosure Sale (NTS and NFS); and Real Estate Owned, or REO properties (that have been foreclosed on and repurchased by a bank). For the annual, midyear and quarterly reports, if more than one type of foreclosure document is received for a property during the timeframe, only the most recent filing is counted in the report. The annual, midyear, quarterly and monthly reports all check if the same type of document was filed against a property previously. If so, and if that previous filing occurred within the estimated foreclosure timeframe for the state where the property is located, the report does not count the property in the current year, quarter or month.
About ATTOM
ATTOM delivers AI-driven property intelligence built on one of the nation's most trusted property data assets, covering 160 million U.S. properties—99% of the population. Our engineered, multi-sourced real estate data spans property tax, deeds, mortgages, foreclosure, environmental risk, property conditions, natural hazards, neighborhood insights, and geospatial boundaries, rigorously validated for advanced analytics. ATTOM supports analytics and AI-driven applications through flexible delivery options including APIs, bulk licensing, cloud delivery, and the MCP Server for AI-powered, agentic access to engineered property data—enabling organizations to automate analysis and scale property intelligence across industries.
Media Contact:
Christine Stricker
949.748.8428
christine.stricker@attomdata.com
Data and Report Licensing:
949.502.8313
datareports@attomdata.com
