Foreclosure Starts, Bank Repossessions at Highest Numbers in Two Years, But Still Well Below Normal Levels
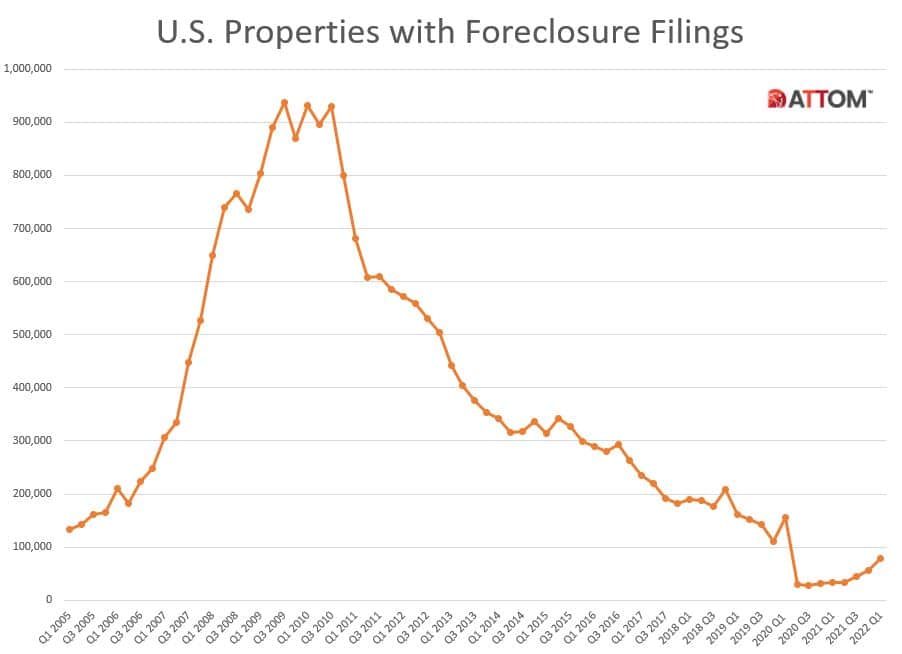
IRVINE, Calif. — April 21, 2022 — ATTOM, licensor of the nation’s most comprehensive foreclosure data and parent company to RealtyTrac (www.realtytrac.com), the largest online marketplace for foreclosure and distressed properties, today released its Q1 2022 U.S. Foreclosure Market Report, which shows a total of 78,271 U.S. properties with a foreclosure filing during the first quarter of 2022, up 39 percent from the previous quarter and up 132 percent from a year ago.
The report also shows a total of 33,333 U.S. properties with foreclosure filings in March 2022, up 29 percent from the previous month and up 181 percent from a year ago — the 11th consecutive month with a year-over-year increase in U.S. foreclosure activity.
“Foreclosure activity has continued to gradually return to normal levels since the expiration of the government’s moratorium, and the CFPB’s enhanced mortgage servicing guidelines,” said Rick Sharga, executive vice president of market intelligence for ATTOM. “But even with the large year-over-year increase in foreclosure starts and bank repossessions, foreclosure activity is still only running at about 57% of where it was in Q1 2020, the last quarter before the government enacted consumer protection programs due to the pandemic.”

Foreclosure starts increase in all 50 states
A total of 50,759 U.S. properties started the foreclosure process in Q1 2022, up 67 percent from the previous quarter and up 188 percent from a year ago.
States that had the greatest number of foreclosures starts in Q1 2022 included, California (5,378 foreclosure starts), Florida (4.707 foreclosure starts), Texas (4,649 foreclosure starts), Illinois (3,534 foreclosure starts), and Ohio (3,136 foreclosure starts).

Those major metros that had the greatest number of foreclosures starts in Q1 2022 included, Chicago, Illinois (3,101 foreclosure starts), New York, New York (2,580 foreclosure starts), Los Angeles, California (1,554 foreclosure starts), Houston, Texas (1,431 foreclosure starts), and Philadelphia, Pennsylvania (1,375 foreclosure starts).
Highest foreclosure rates in Illinois, New Jersey and Ohio
Nationwide one in every 1,795 housing units had a foreclosure filing in Q1 2022. States with the highest foreclosure rates were Illinois (one in every 791 housing units with a foreclosure filing); New Jersey (one in every 792 housing units); Ohio (one in every 991 housing units); South Carolina (one in every 1,081 housing units); and Nevada (one in every 1,090 housing units).
Among 223 metropolitan statistical areas with a population of at least 200,000, those with the highest foreclosure rates in Q1 2022 were Cleveland, Ohio (one in every 535 housing units); Atlantic City, New Jersey (one in 600); Jacksonville, North Carolina (one in 633); Rockford, Illinois (one in 634); and Columbia, South Carolina (one in 672).
Other major metros with a population of at least 1 million and foreclosure rates in the top 20 highest nationwide, included Cleveland, Ohio at No.1, Chicago, Illinois at No. 6, Detroit, Michigan at No. 10, Las Vegas, Nevada at No. 13, and Jacksonville, Florida at No. 16.
Bank repossessions increase 41 percent from last quarter
Lenders repossessed 11,824 U.S. properties through foreclosure (REO) in Q1 2022, up 41 percent from the previous quarter and up 160 percent from a year ago.

Those states that had the greatest number of REOs in Q1 2022 were Michigan (1,592 REOs); Illinois (1,288 REOs); Florida (673 REOs); California (655 REOs); and Pennsylvania (639 REOs).
Average time to foreclose decreases 3 percent from previous quarter
Properties foreclosed in Q1 2022 had been in the foreclosure process an average of 917 days, down slightly from 941 days in the previous quarter and down 1 percent from 930 days in Q1 2021.
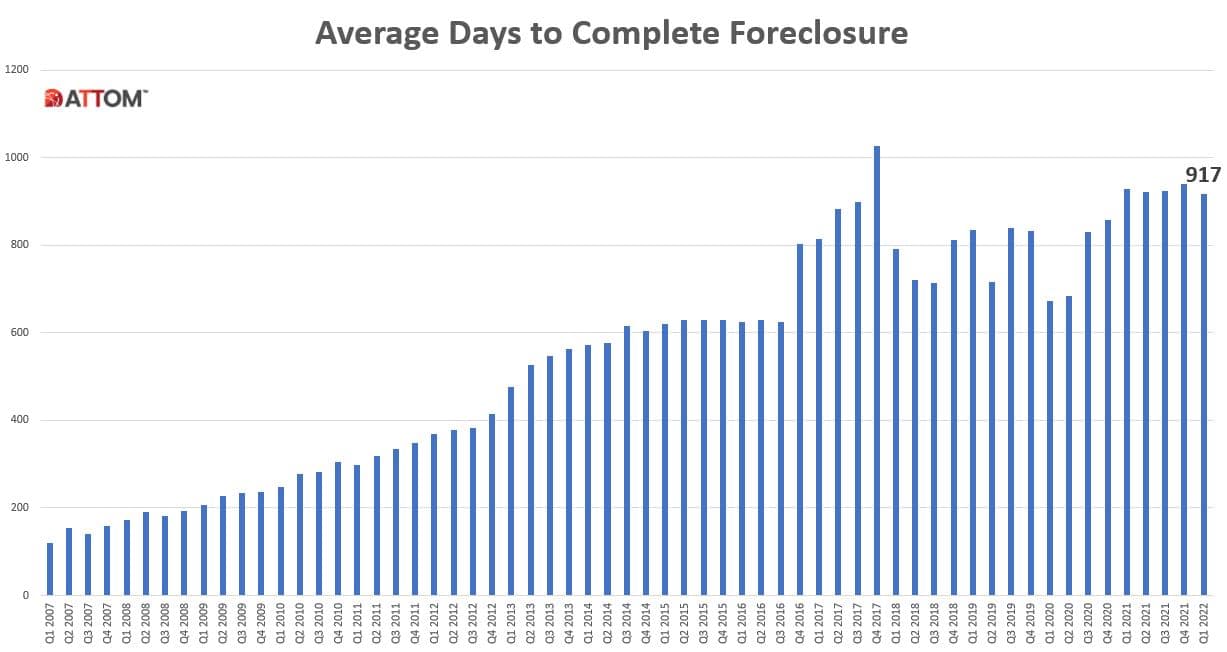
States with the longest average foreclosure timelines for homes foreclosed in Q1 2022 were Hawaii (2,578 days); Louisiana (1,976 days); Kentucky (1,891 days); Nevada (1,808 days); and Connecticut (1,632 days).
States with the shortest average foreclosure timelines for homes foreclosed in Q1 2022 were Montana (133 days); Mississippi (146 days); West Virginia (197 days); Wyoming (226 days); and Minnesota (228 days).
March 2022 Foreclosure Activity High-Level Takeaways
“March foreclosure activity was at its highest level in exactly two years – since March 2020, when there were almost 47,000 foreclosure filings across the country,” Sharga added. “It’s likely that we’ll continue to see significant month-over-month and year-over-year growth through the second quarter of 2022, but still won’t reach historically normal levels of foreclosures until the end of the year at the earliest, unless the U.S. economy takes a significant turn for the worse.”
- Nationwide in March 2022, one in every 4,215 properties had a foreclosure filing.
- States with the highest foreclosure rates in March 2022 were Illinois (one in every 1,825 housing units with a foreclosure filing); New Jersey (one in every 2,022 housing units); South Carolina (one in every 2,299 housing units); Delaware (one in every 2,579 housing units); and Ohio (one in every 2,604 housing units).
- 22,360 U.S. properties started the foreclosure process in March 2022, up 35 percent from the previous month and up 248 percent from March 2021.
- Lenders completed the foreclosure process on 4,406 U.S. properties in March 2022, up 67 percent from the previous month and up 180 percent from March 2021.
U.S. Foreclosure Market Data by State – Q1 2022
| Rate Rank | State Name | Total Properties with Filings | 1/every X HU (Foreclosure Rate) | %∆ Q4 2021 | %∆ Q1 2021 |
| U.S. | 78,271 | 1,795 | 39.34 | 132.27 | |
| 18 | Alabama | 1,143 | 2,002 | 68.83 | 78.87 |
| 44 | Alaska | 52 | 6,106 | -17.46 | -32.47 |
| 15 | Arizona | 1,656 | 1,861 | 165.38 | 134.23 |
| 34 | Arkansas | 441 | 3,096 | 31.25 | 143.65 |
| 12 | California | 8,243 | 1,746 | 31.80 | 119.64 |
| 32 | Colorado | 830 | 3,002 | 162.66 | 385.38 |
| 14 | Connecticut | 824 | 1,857 | 26.38 | 120.32 |
| 6 | Delaware | 386 | 1,163 | 29.97 | 51.97 |
| District of Columbia | 47 | 7,455 | 0.00 | 147.37 | |
| 8 | Florida | 8,147 | 1,211 | 0.85 | 92.87 |
| 10 | Georgia | 2,592 | 1,702 | 55.58 | 123.64 |
| 30 | Hawaii | 194 | 2,892 | -0.51 | 84.76 |
| 43 | Idaho | 125 | 6,015 | 16.82 | 111.86 |
| 1 | Illinois | 6,861 | 791 | 17.99 | 178.45 |
| 7 | Indiana | 2,415 | 1,210 | 58.05 | 100.58 |
| 16 | Iowa | 728 | 1,941 | 34.32 | 78.00 |
| 40 | Kansas | 270 | 4,725 | 74.19 | 147.71 |
| 41 | Kentucky | 417 | 4,783 | 18.13 | 7.75 |
| 22 | Louisiana | 907 | 2,286 | 52.18 | 18.72 |
| 17 | Maine | 373 | 1,981 | 23.10 | 81.07 |
| 11 | Maryland | 1,483 | 1,707 | 21.16 | 132.45 |
| 35 | Massachusetts | 966 | 3,104 | 14.59 | 68.29 |
| 9 | Michigan | 3,205 | 1,426 | 190.57 | 490.24 |
| 37 | Minnesota | 773 | 3,215 | 72.93 | 170.28 |
| 33 | Mississippi | 433 | 3,048 | 86.64 | 73.20 |
| 24 | Missouri | 1,151 | 2,421 | 68.03 | 75.73 |
| 45 | Montana | 77 | 6,686 | 71.11 | 97.44 |
| 36 | Nebraska | 267 | 3,162 | 190.22 | 178.13 |
| 5 | Nevada | 1,175 | 1,090 | 22.91 | 487.50 |
| 38 | New Hampshire | 193 | 3,310 | 47.33 | 96.94 |
| 2 | New Jersey | 4,752 | 792 | 69.29 | 311.79 |
| 25 | New Mexico | 376 | 2,502 | 15.69 | 44.06 |
| 26 | New York | 3,215 | 2,640 | 25.54 | 261.64 |
| 20 | North Carolina | 2,265 | 2,079 | 38.03 | 102.59 |
| 47 | North Dakota | 35 | 10,590 | -65.00 | -12.50 |
| 3 | Ohio | 5,289 | 991 | 46.31 | 154.16 |
| 13 | Oklahoma | 956 | 1,827 | 49.84 | 111.50 |
| 46 | Oregon | 239 | 7,589 | 143.88 | 95.90 |
| 21 | Pennsylvania | 2,702 | 2,125 | 61.70 | 102.09 |
| 39 | Rhode Island | 141 | 3,429 | -20.79 | 147.37 |
| 4 | South Carolina | 2,170 | 1,081 | 76.42 | 158.95 |
| 50 | South Dakota | 22 | 17,724 | 10.00 | -8.33 |
| 28 | Tennessee | 1,084 | 2,797 | 49.52 | 125.36 |
| 23 | Texas | 4,982 | 2,326 | 36.61 | 130.33 |
| 19 | Utah | 558 | 2,063 | 67.57 | 71.17 |
| 49 | Vermont | 24 | 13,930 | 9.09 | 200.00 |
| 29 | Virginia | 1,287 | 2,811 | 45.75 | 118.88 |
| 42 | Washington | 645 | 4,965 | 38.71 | 109.42 |
| 48 | West Virginia | 79 | 10,831 | 125.71 | 119.44 |
| 27 | Wisconsin | 983 | 2,775 | 30.54 | 42.26 |
| 31 | Wyoming | 93 | 2,924 | 43.08 | 14.81 |
Report Methodology
The ATTOM U.S. Foreclosure Market Report provides a count of the total number of properties with at least one foreclosure filing entered into the ATTOM Data Warehouse during the month and quarter. Some foreclosure filings entered into the database during the quarter may have been recorded in the previous quarter. Data is collected from more than 3,000 counties nationwide, and those counties account for more than 99 percent of the U.S. population. ATTOM’s report incorporates documents filed in all three phases of foreclosure: Default — Notice of Default (NOD) and Lis Pendens (LIS); Auction — Notice of Trustee Sale and Notice of Foreclosure Sale (NTS and NFS); and Real Estate Owned, or REO properties (that have been foreclosed on and repurchased by a bank). For the annual, midyear and quarterly reports, if more than one type of foreclosure document is received for a property during the timeframe, only the most recent filing is counted in the report. The annual, midyear, quarterly and monthly reports all check if the same type of document was filed against a property previously. If so, and if that previous filing occurred within the estimated foreclosure timeframe for the state where the property is located, the report does not count the property in the current year, quarter, or month.
Interested in finding out more about our pre-foreclosure and foreclosure data?
Contact ATTOM for Foreclosure Data Licensing Details.
Visit RealtyTrac.com for Foreclosure Search and Listings.
About ATTOM
ATTOM provides foreclosure data licenses that can power various enterprise industries including real estate, insurance, marketing, government, mortgage and more. ATTOM multi-sources from 3,000 counties property tax, deed, mortgage, environmental risk, natural hazard, and neighborhood data for more than 155 million U.S. residential and commercial properties covering 99 percent of the nation’s population.
About RealtyTrac (Powered by ATTOM’s Property Data)
RealtyTrac.com is the largest online marketplace for foreclosure and distressed properties, helping individual investors and real estate agents looking to gain a competitive edge in the distressed market. Realtytrac.com enables real estate professionals the ability to find, analyze and invest in residential properties.
Media Contact:
Christine Stricker
949.748.8428
christine.stricker@attomdata.com
Data and Report Licensing:
949.502.8313
